Your first script
In about ten minutes you will build a real graph: find every item whose Material contains "Concrete", colour it red, and save it as a selection set. About six nodes, no code.
You need CamelGraph installed and a model open in Navisworks (a Revit, IFC or DWG model appended to a new .nwd is fine).
1. Open the editor and meet the screen
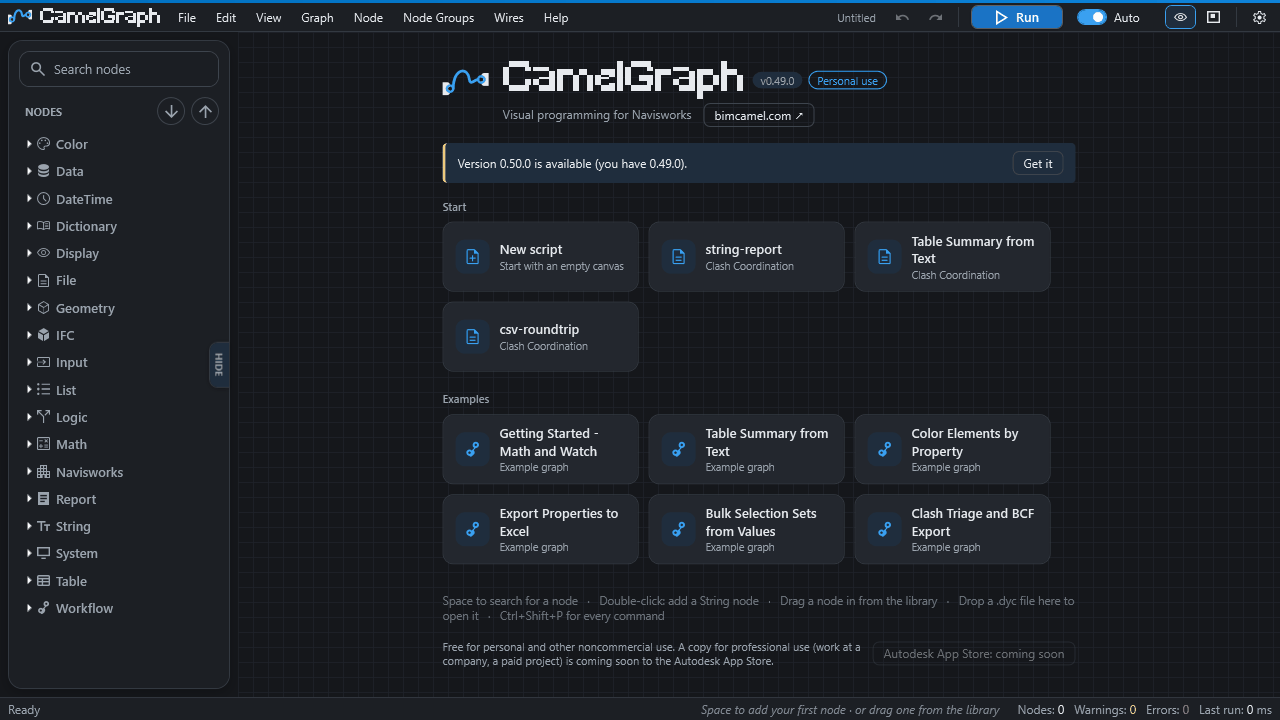
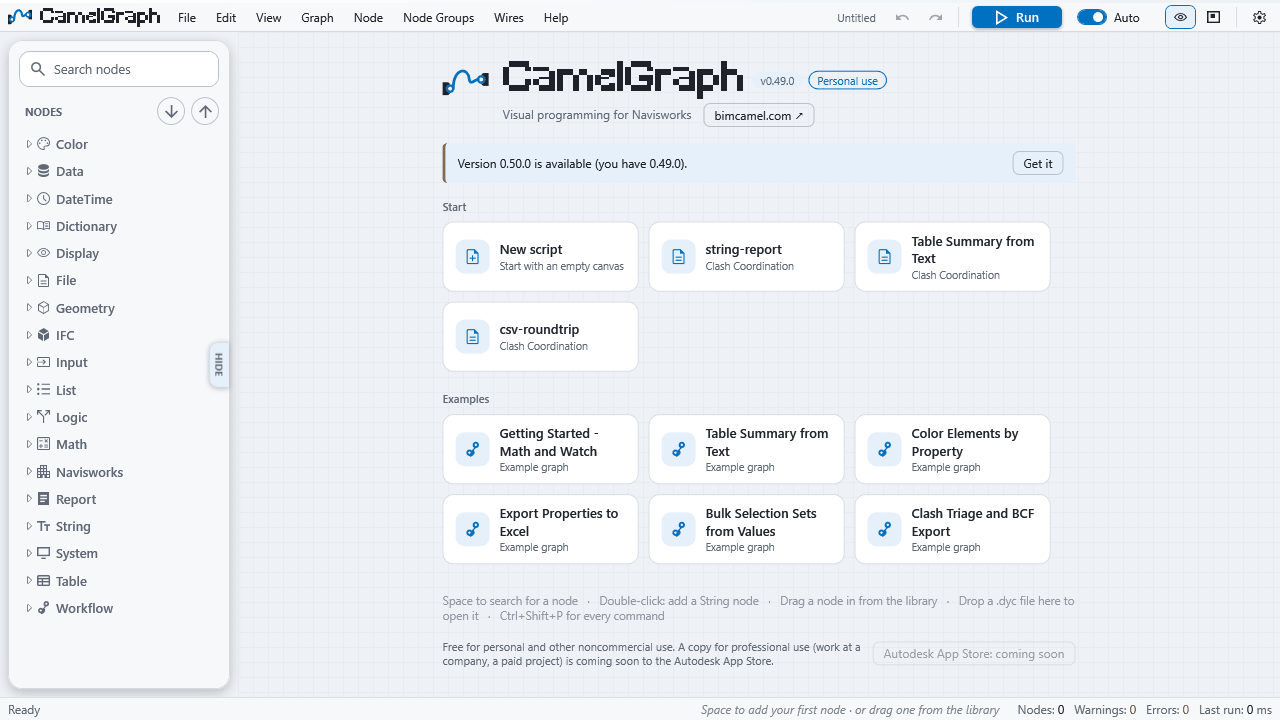
On the BIMCamel ribbon tab, click CamelGraph. The editor opens as a pane. Its parts:
- Library (left): every node, in a category tree, with a search box. Double-click a node, or drag it onto the canvas.
- Canvas (middle): your graph. Pan by dragging with the right or middle mouse button, zoom with the wheel, box-select with the left button.
- Run bar (bottom): the Run button, the Manual / Auto switch and the status line.
While the canvas is empty the start screen shows cards: New script, your recent scripts and the examples. It disappears when you add a node or open a script.
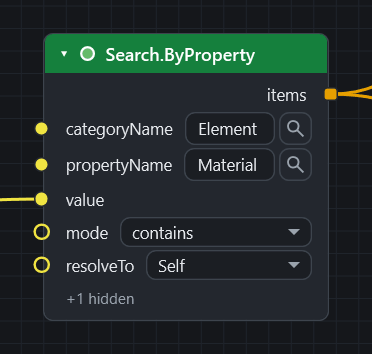
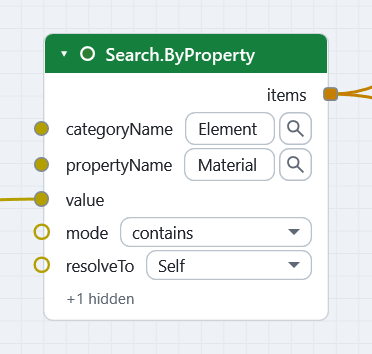
Every node shows its inputs on the left and its outputs on the right. Drag from an output socket to an input socket to make a wire. The wire is the data flow.
Three habits that save time from day one:
- Press Space over the canvas to search for a node right where the cursor is. Type part of the name, Up and Down to choose, Enter to insert, Esc to close.
- Hover a socket to see what it expects: its name, its kind, whether it is required, its default and a description.
- Press Ctrl+Shift+P for the command palette: type a word of any command or setting.
2. Find the names in Navisworks
Click a concrete element in Navisworks and look at the Properties window. Find the tab (also called category) and the row (the property) that holds the material text. In Revit-sourced models this is usually category Element, property Material; other formats often use Item and Material. CamelGraph searches by exactly the names you see, including their language.
3. The search
- Add a String node (category Input): press Space, type
Stringand insert it. Double-click its title, rename itMaterial textand typeConcreteinto it. - Press Space, type
Search.ByProperty, and insert Search.ByProperty (category Navisworks ▸ Search). - Type into its inputs:
categoryName:Element(or what you found),propertyName:Material,mode: choosecontainsfrom the drop-down. The other modes areequals,wildcard,>,>=,<and<=.
- Wire the
valueoutput of the String node into thevalueinput of the search. Thevalueinput accepts any kind of value (a text, a number, a date), so it has no box of its own: you wire a String or Number node into it. - Leave
documentalone. A Document input uses the active document when nothing is wired to it. - Add a Watch List node (category Display) and wire
itemsfrom the search into itslist. - Press Run (F5).
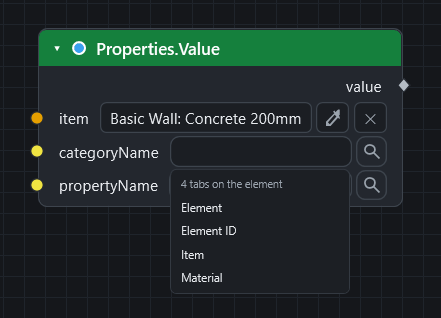
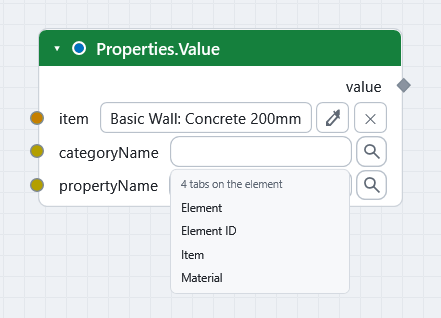
The Watch List fills with every matching item. If it is empty, the names do not match what Navisworks shows. The categoryName and propertyName boxes have a small magnifier button: select an element in Navisworks, press the magnifier, and pick the tab and then the property from a list that shows only what that element has. Nothing is read until you press it.
The search text is case sensitive
The contains search is documented as case sensitive, like Find Items in Navisworks. Type Concrete the way the Properties window shows it. To see all the ways to find a name, read Find the name of a tab or property.
4. Colour the result
- Add Appearance.OverrideColor (Navisworks ▸ Appearance).
- Wire
itemsfrom the search into itsitemsinput. - Click the colour swatch on its
colorinput and choose red. - Press Run. Every concrete item in the viewport turns red.
This is a real Navisworks colour override, as if you had used Item Tools ▸ Override Color. To take it back from a graph, use Appearance.Reset (or Appearance.ResetAll for a clean slate before you colour again).
Save the model before you experiment
Whether one Navisworks Undo reverses a whole run has not been confirmed. The editor's own undo (Ctrl+Z while the pane has the focus) changes the graph only.
5. Save it as a selection set
- Add SelectionSet.Create (Navisworks ▸ SelectionSets).
- Wire the
itemsoutput of Appearance.OverrideColor into itsitemsinput. Nodes that change the model pass their items through for exactly this reason, so you can chain them. - Type
Concrete elementsinto itsnameinput. - Press Run. The set appears in the Navisworks Sets window.
SelectionSet.Createreplaces a top-level set with the same name, so running again updates it instead of duplicating it.
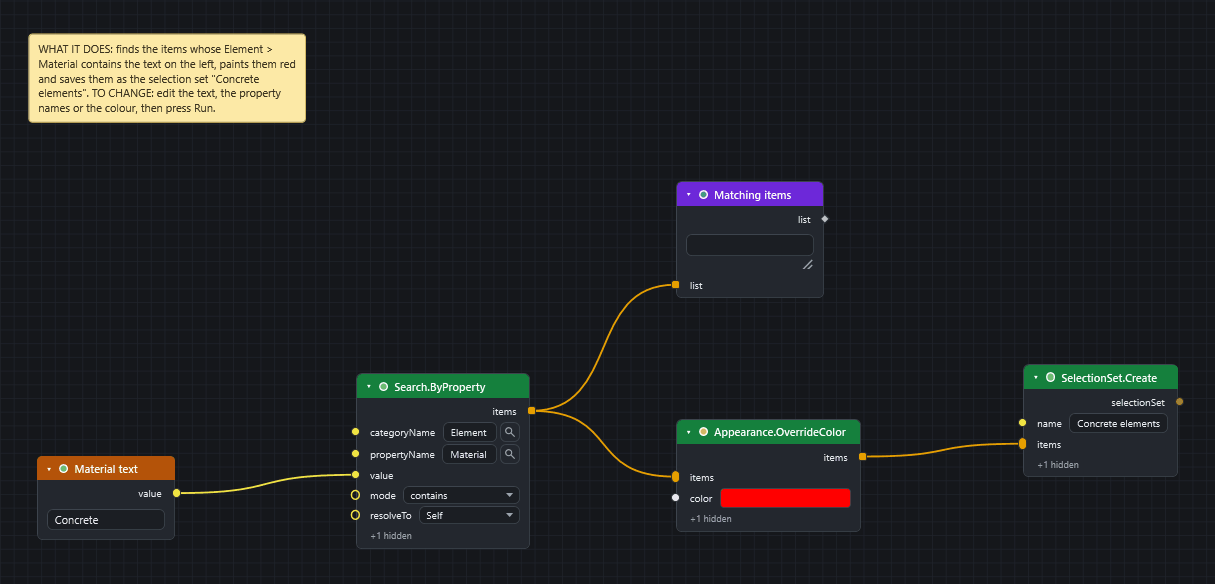
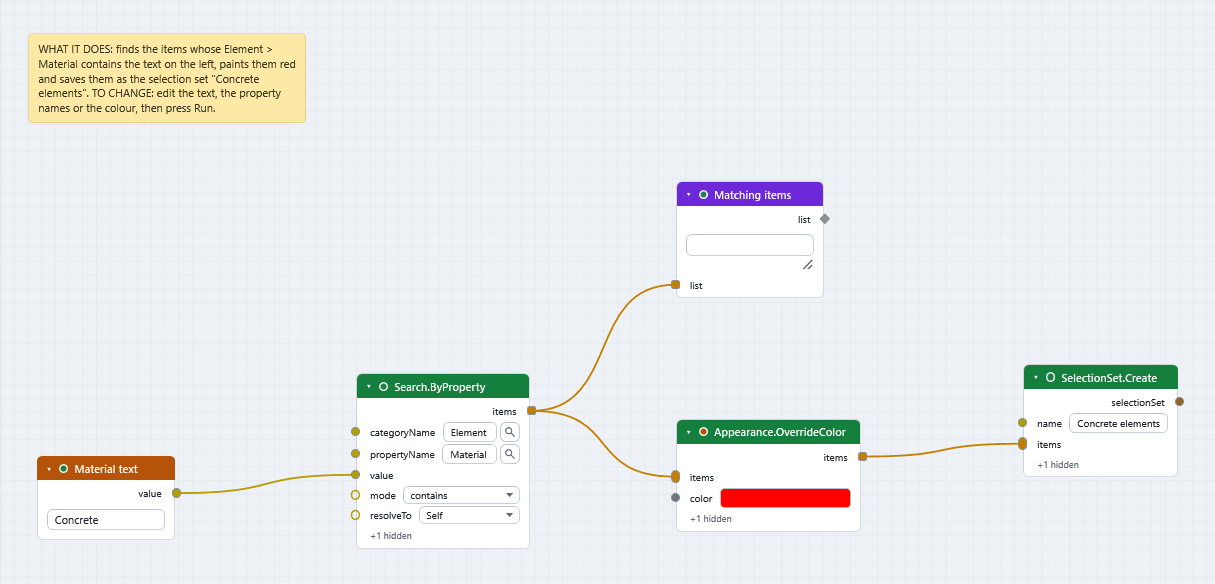
The finished graph:
String ──value──▶ Search.ByProperty ──items──▶ Appearance.OverrideColor ──items──▶ SelectionSet.Create
(Concrete)        (Element / Material /           (colour: red)                (name: Concrete elements)
                   contains)
                          └──items──▶ Watch List
The same steps with a download, and a version that gives every value its own colour, are in Colour elements by a property and Save selection sets.
6. Make it live
Switch the run bar from Manual to Auto. Change the text of the String node from Concrete to Steel: the graph runs again by itself and recolours the model. Only the nodes after your edit run again; the rest serve their stored results, which is what keeps large graphs fast.
7. Save the graph
Press Ctrl+S and save a .dyc file. It stores the nodes, wires and the values you typed, not the results, so a graph you open later computes afresh on its first run. It is plain text, so it can be emailed or kept in version control. Save it in Documents\CamelGraph\Scripts and the Script Player lists it.
8. One search for many values
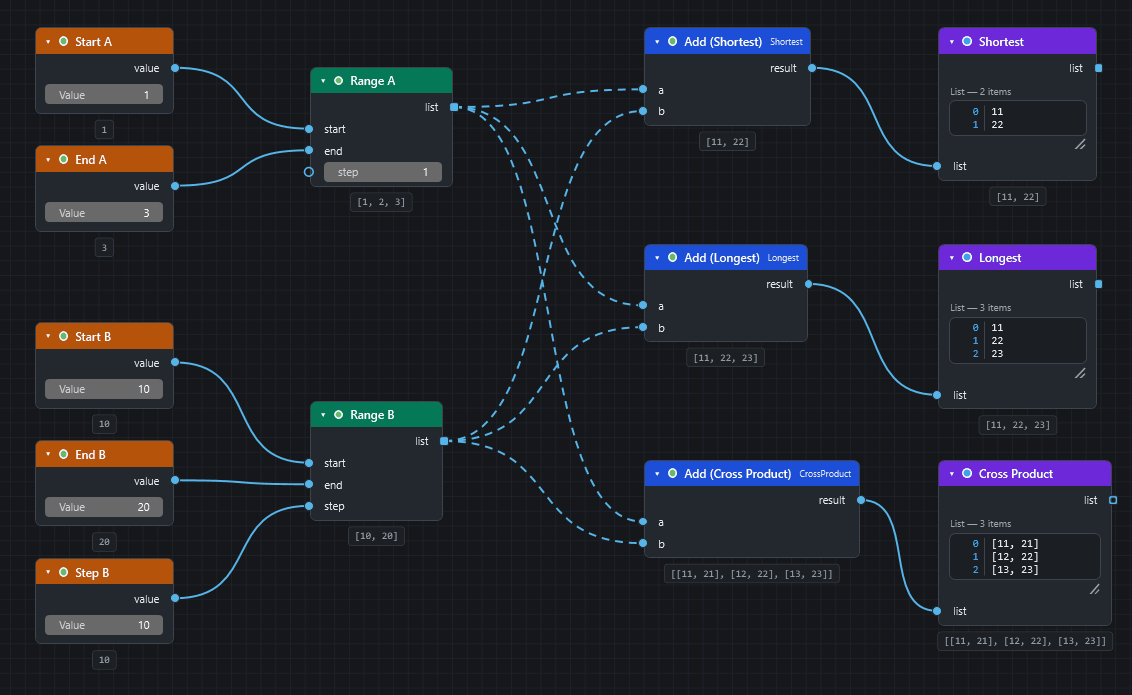
Lists are where CamelGraph pays off. Add a String.Split node (category String) with the text Concrete,Steel,Masonry and the separator ,. Its result is a list of three texts.
- Wire the result into the
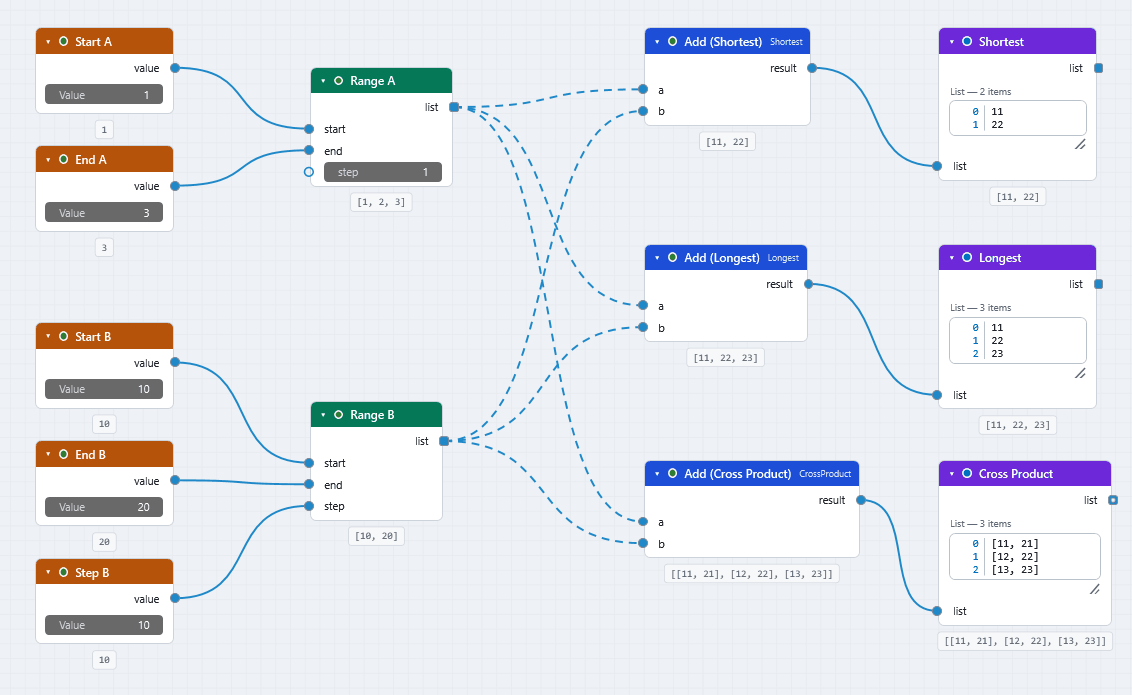
nameinput of SelectionSet.Create.namewants one text, so the node runs three times, once for each text. The wire is drawn dashed to show this. - Wire the same result into the
valueinput of the search, instead of the single String node. This input accepts any kind of value, so it takes a list as one single value unless you ask for more. Right-click thevaluesocket, choose List Levels and then@L1 — items. A small@L1badge appears, and the search now runs three times and gives three lists of items. - Press Run. The three lists pair up with the three names, and one run makes three sets.
This is replication, and how several lists pair up is lacing. Both are explained in Concepts.
When something is red
A node that fails shows a red border and a message; hover it, or open the Errors count in the status bar. Press I with a node selected to hear in words why it did or did not run. The full list of what red, amber and idle mean is in Running a graph and Troubleshooting.
Where next
- The How-to guides in the menu each solve one job with a graph you can download, for example Take quantities out to Excel and Read errors and warnings.
- Concepts and Inputs, outputs and kinds explain how graphs behave.
- Sample scripts are finished graphs to open, run and take apart.
- Recipes list node chains for the jobs of a BIM coordinator, a manager and a model maintainer.
- The node library lists every node with its inputs and outputs.