Make a clash report
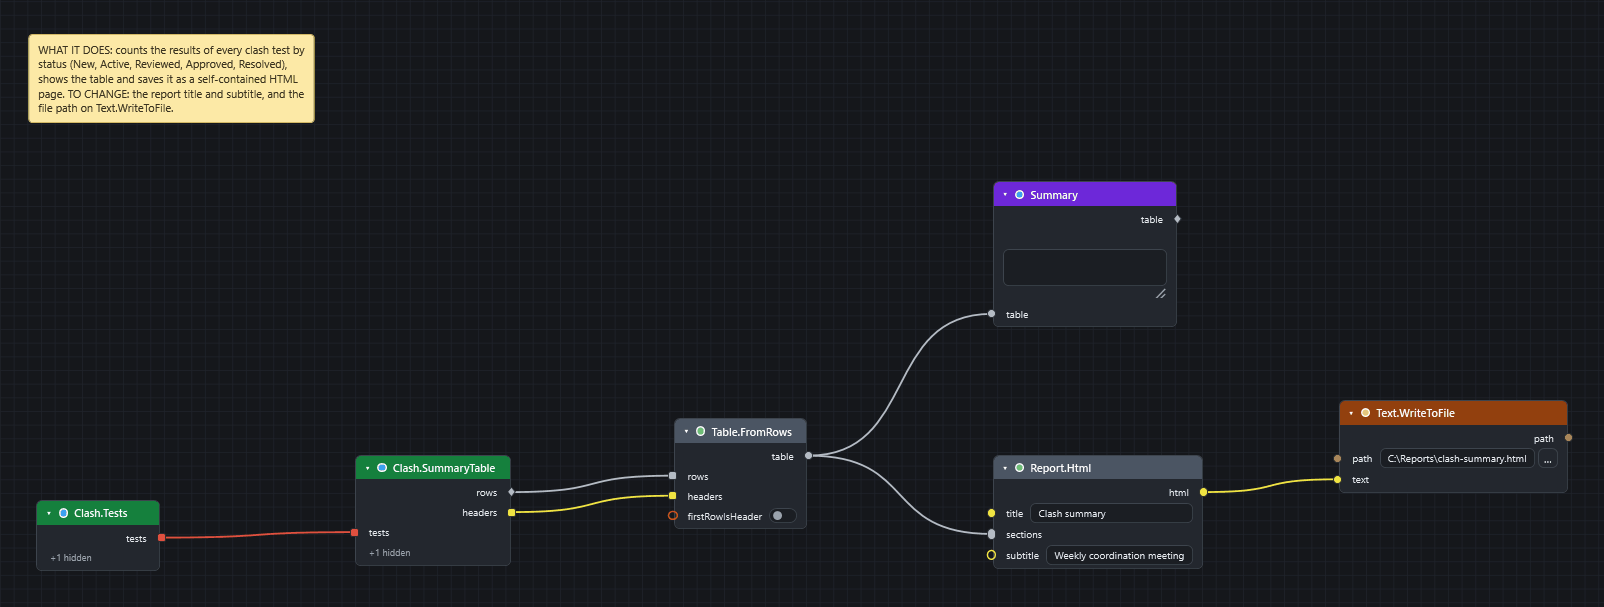
Goal: write an HTML page that shows, for each clash test, how many results are New, Active, Reviewed, Approved and Resolved.
Before you start
- Use Navisworks Manage. Simulate does not include Clash Detective, so the clash nodes cannot work there.
- Open a model that already has clash tests, and run them in Clash Detective. A test that has not run has no results to count.
- Open the CamelGraph editor.
Steps
- Add
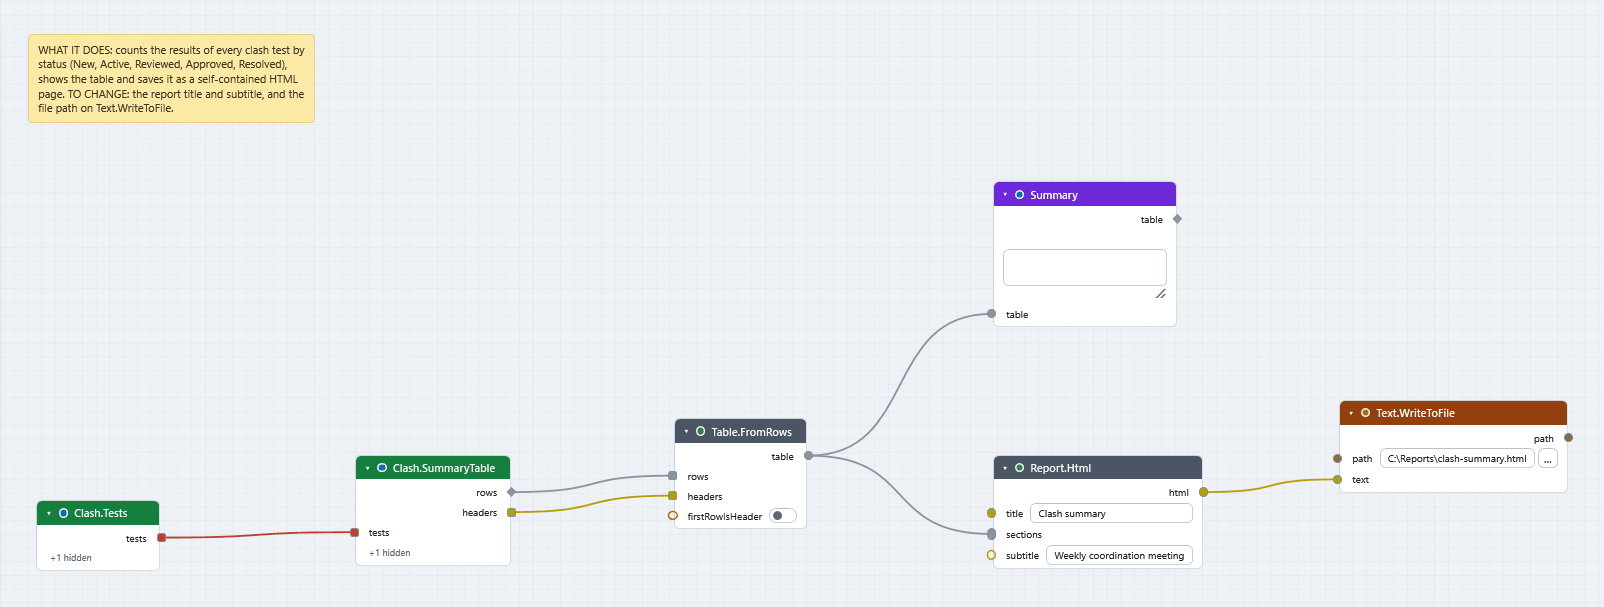
Clash.Tests(Navisworks ▸ Clash ▸ Tests). It gives every clash test in the document, including those inside folders. - Add
Clash.SummaryTable(Navisworks ▸ Clash ▸ Report). WiretestsfromClash.Testsinto itstests. It makes one row for each test with the columns Test, Total and one for each status (New, Active, Reviewed, Approved, Resolved). Leavetestsunwired to cover every test withoutClash.Tests. An empty list wired intotests(a filter that found no test) gives a table with the headers and no rows, not a report on every test. The node also has atableoutput that goes straight into the Table, CSV and Excel nodes, soTable.FromRowsis only needed when you start fromrowsandheaders. - Add
Table.FromRows(Table). Wirerowsintorowsandheadersintoheaders. The summary node gives rows and headers separately, and this node joins them into one table. - Add
Report.Html(Report). Wire the table intosections. Type a title, such asClash summary, intotitle, and a line such as the model name and date intosubtitle. - Add
Text.WriteToFile(File). Wirehtmlintotext. Type a full path intopath, for exampleC:\Reports\clash-summary.html. - Add a
Watch Table(Display) on thetableoutput ofTable.FromRowsto see the numbers on the canvas. - Press F5, then open the file in a browser.
What you get
A self-contained HTML page with a light and a dark style, ready to print or paste into an e-mail. A line in a section that starts with # becomes a heading, so you can add text sections above or below the table. Wire several tables or texts into the one sections socket; they appear top to bottom in wire order.
Quick alternatives
Export.ClashReport(Navisworks ▸ Export) with an.htmlpath writes a single-file HTML report with one section per test and one row per result, and can embed a snapshot of each result (Advanced:includeImages). With a.csvpath it writes the same detail as a file you can open in Excel.Report.Markdownbuilds the same report as Markdown for Teams or an issue tracker.
Keep a weekly history
Clash.SnapshotToFile saves a snapshot of all results as JSON, and Clash.CompareSnapshots compares two snapshot files and lists the clashes that are new, resolved and persisting. See Recipes.
If it does not work
- All counts are 0 or the table is empty: the tests have not been run, or the document has no tests.
- A clash node is red with "Clash Detective is not available in this Navisworks edition.": you are in a product without Clash Detective, such as Simulate.
- The file node fails with "access denied": use a full path (why).
- A node is red: see Read errors and warnings.
Next
- Send clashes to BCF.
- Clash nodes lists filters, groupings and the result nodes.
- Sample scripts includes Clash Triage and BCF Export.