Give colleagues a form with the Script Player
Goal: build a graph whose inputs appear as a form in the Script Player, so a colleague fills in a few fields, presses Run and reads the result.
Before you start
- Open a model in Navisworks and the CamelGraph editor.
- You build and test the graph. Your colleague only needs CamelGraph installed and a model open.
- The example finds items by their volume and writes them to an Excel file. Replace the names with your own.
Steps: build the graph
- Add a
Numbernode (Input). Double-click its title and rename itVolume limit. The name becomes the label of the field. Type2as the value. - Add a
Choicenode (Input) and rename itVolume is. In its Options, one per line box type>,>=,<and<=on four lines. The drop-down above the box then offers all four and starts on the first. - Add a
File Pathnode (Input) and rename itSave the list as. Type a full path such asC:\Reports\large-items.xlsxinto its box. The…button only picks a file that exists, so type the path of a new file. - Add
Search.ByProperty(Navisworks ▸ Search) withcategoryName=ElementandpropertyName=Volume. WirevaluefromChoiceinto itsmodeandvaluefromNumberinto itsvalue. - Add
Properties.ToTable(Navisworks ▸ Properties) and wire the searchitemsinto it. Feedpropertiesfrom aString.Split(String) with the separator,, fed by aStringnode with the text@Name,Element.Category,Element.Volume. - Add
Table.ToExcelFile(Table). Wire the table intotableandpathfromFile Pathintopath. TypeLarge itemsintosheet. - Add a
Watch Table(Display), rename itItems found, and wire the table into it. Press F5 and check it works. - Choose Graph ▸ Script Description… and type what the script does. It is shown above the form.
- Save with Ctrl+S into
Documents\CamelGraph\Scripts.
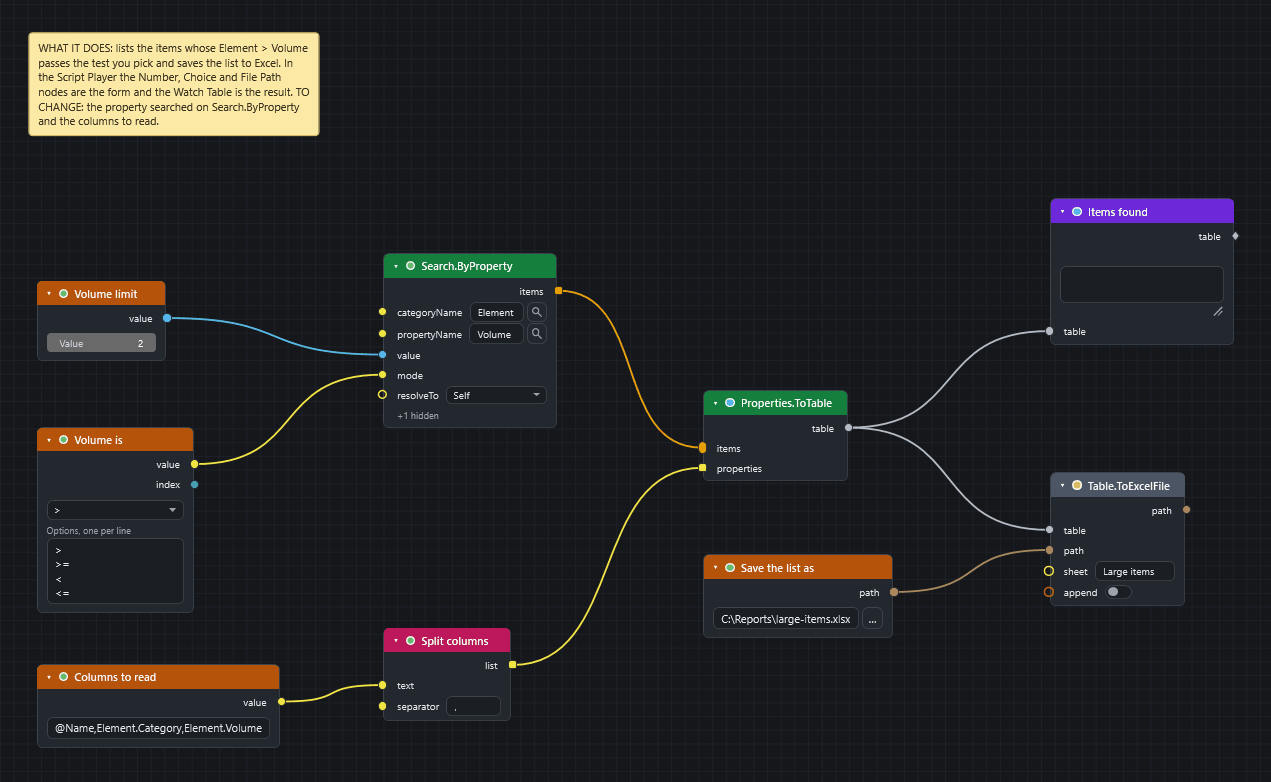
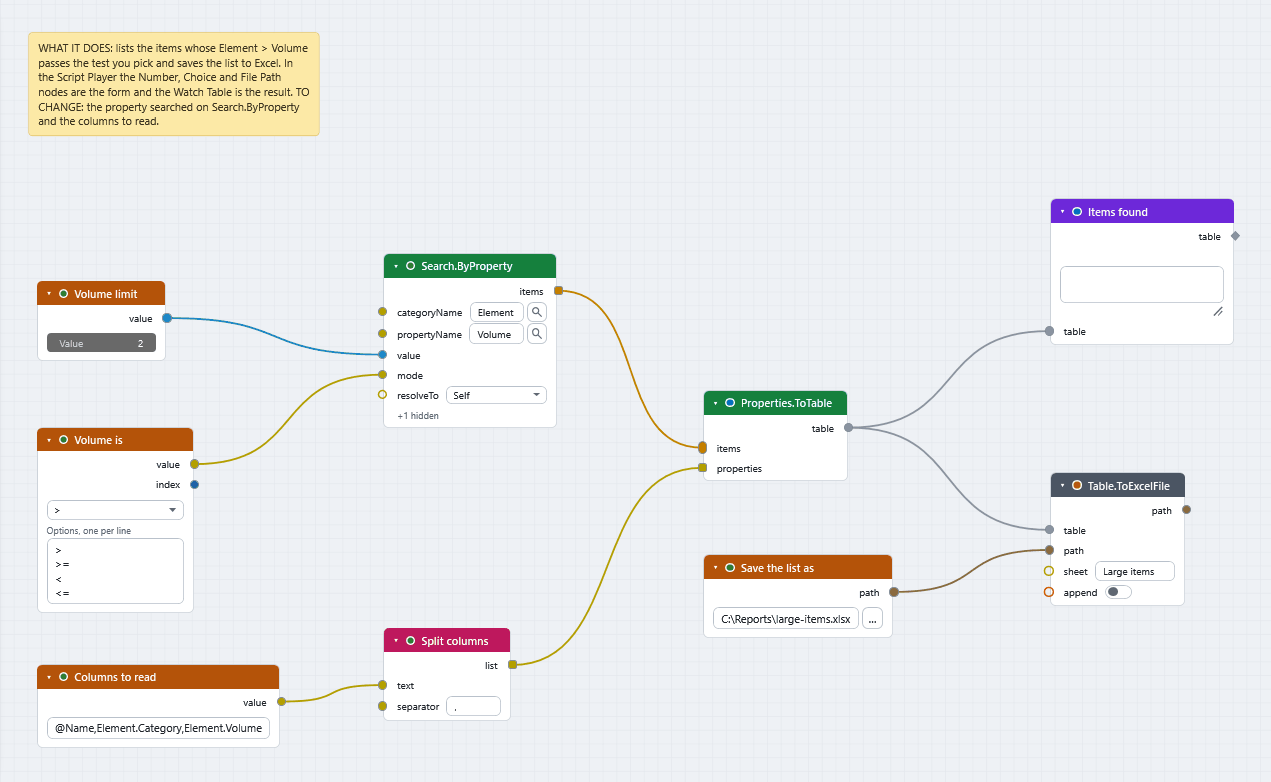
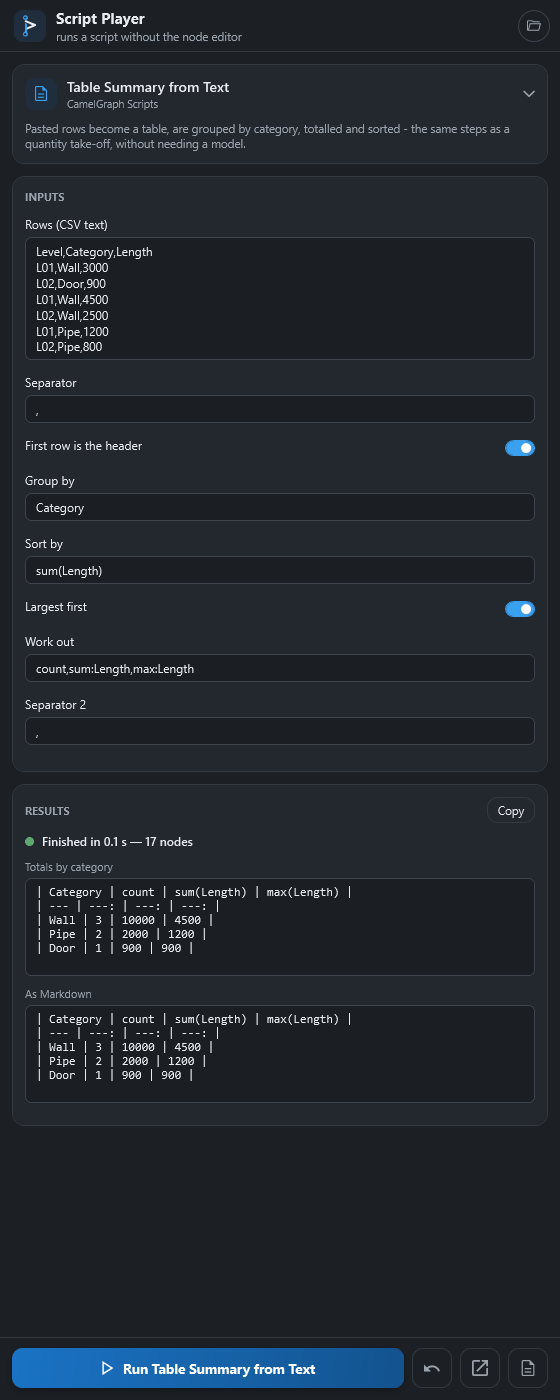
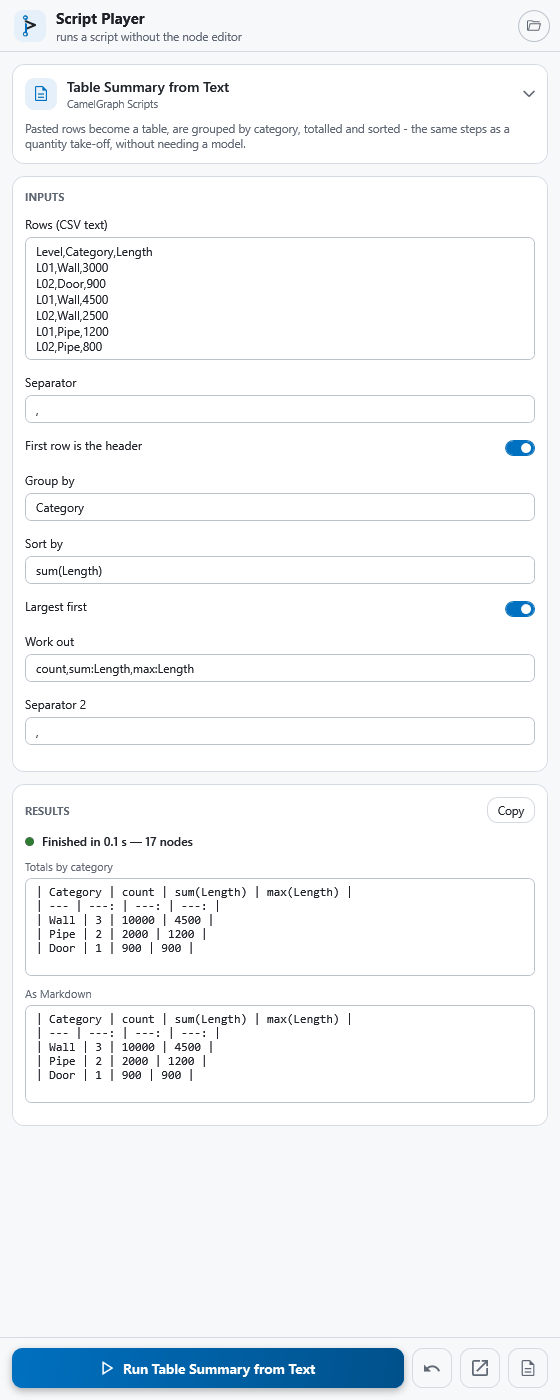
The Player shows every input node by default, top to bottom in the order the nodes sit on the canvas, and the Watch nodes in its results. Other nodes are hidden. To offer any other unwired input as a field, right-click its socket and choose Show in Player. A small ▶ badge marks nodes the Player uses. Press Ctrl+Alt+P on selected nodes to show or hide them in the Player. Put inputs at the top level of the graph: inputs inside a node group are not offered.
Steps: run it as your colleague
- Click Player on the BIMCamel ribbon tab. Choose the script from the list.
- Fill in the form: a number, a choice, a file path.
- Press Run. Because the script writes a file, the Player lists the nodes responsible and asks "Run it?" the first time, and again whenever the file changes.
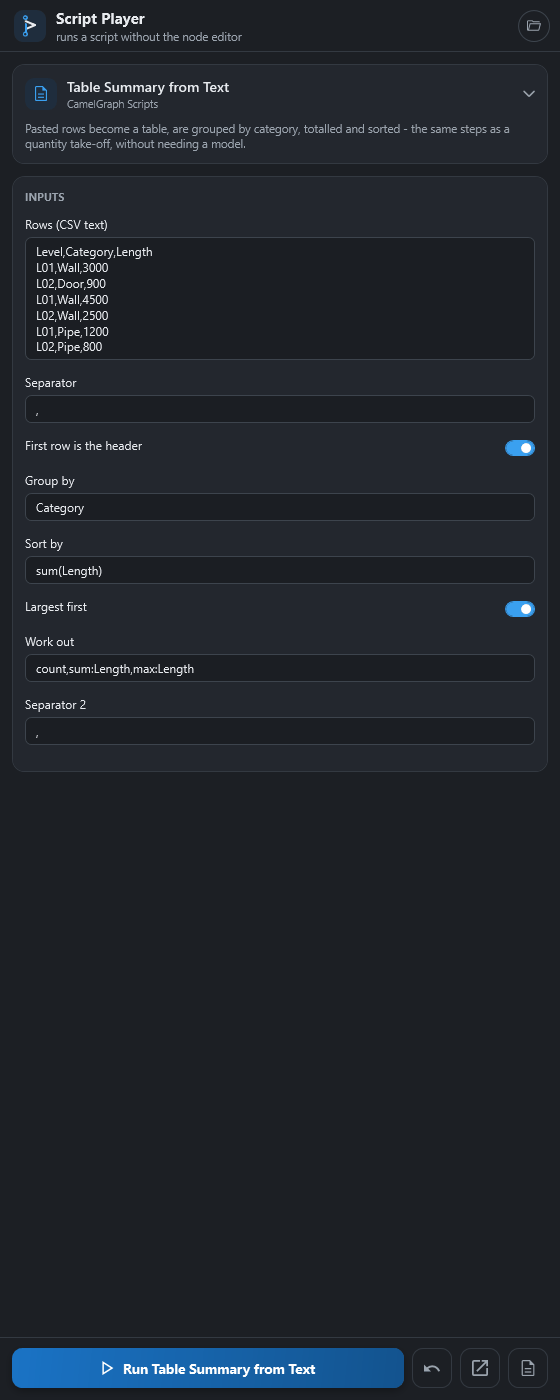
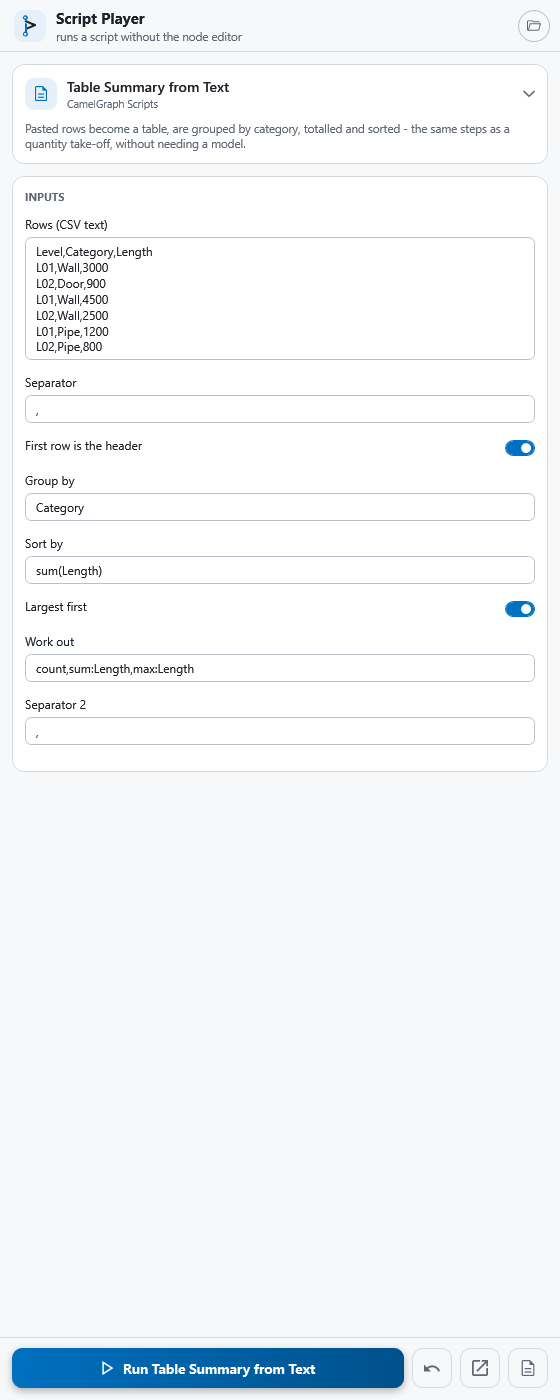
What you get
After the run the Player shows a results card: a green or red dot with a summary line, the value of each Watch node, and below it any node that failed or warned. Copy puts the report on the clipboard as text for an e-mail. The values your colleague typed are remembered for that script.
If it does not work
- The script is not in the list: save it in
Documents\CamelGraph\Scriptsor add its folder (the folder button in the header opens Script folders), then press ↻. - The Player says a node is not installed: the script cannot run until it is. See A graph opens with a warning, or with missing nodes.
- The confirmation question appears: that is a safety check, not an error.
Next
- The Script Player describes the form, results and safety in full.
- Reuse a piece of graph as a node group.
- Saving and opening scripts.