Sample scripts
CamelGraph ships with example graphs. Open them from the start screen (the cards on an empty canvas), from File ▸ Sample Graphs, or from the Samples folder inside each year folder of the installed bundle. Each one explains its editable inputs in notes on the canvas. Press Run to see what it does; read the nodes to learn how.
Except for the first two, the samples need Navisworks with a model open. They are saved so that you decide when they run: a graph opened from a file is not run until you press Run.
Without a model
| Sample | What it shows |
|---|---|
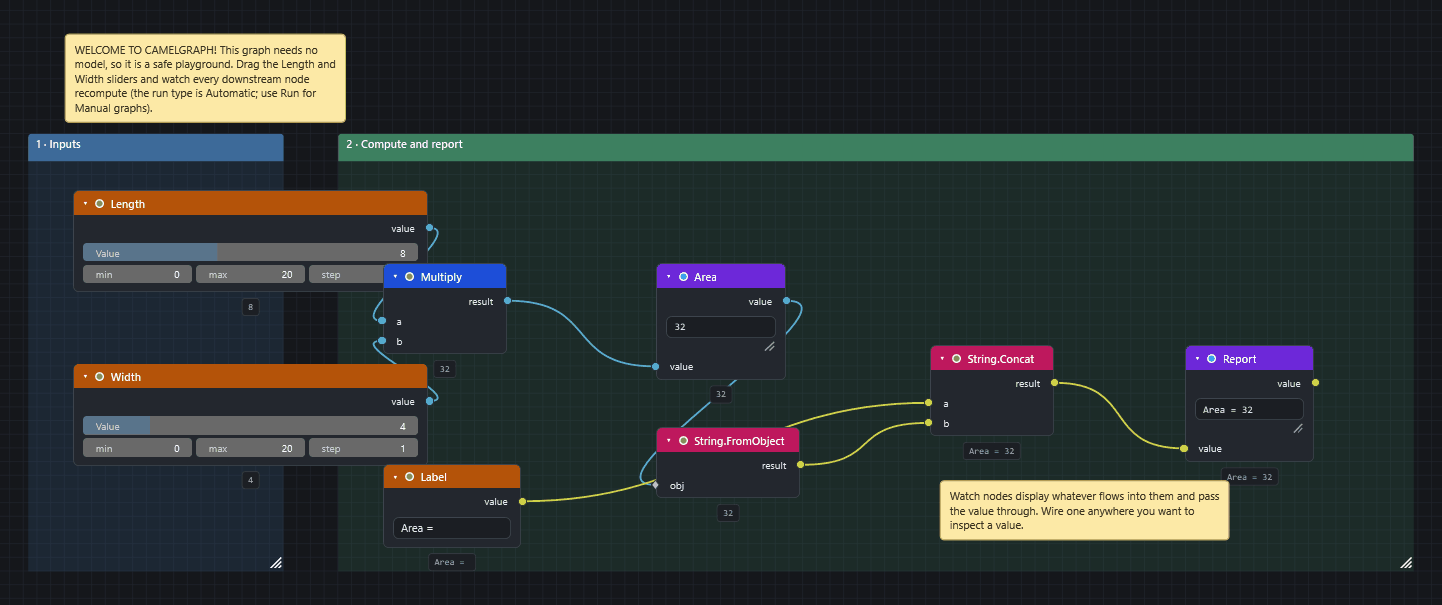
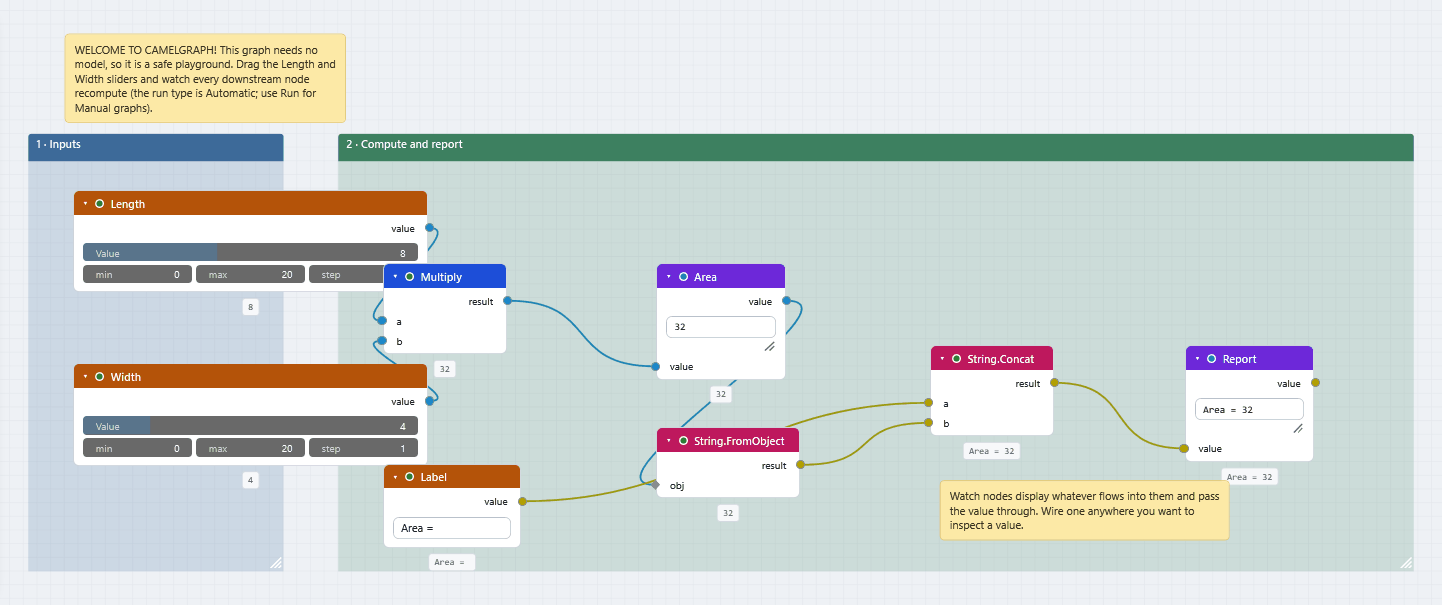
| Getting Started - Math and Watch | Two sliders multiplied into an area, shown in a Watch node and formatted into a text report with String.FromObject and String.Concat. Expected results: 32 and Area = 32. |
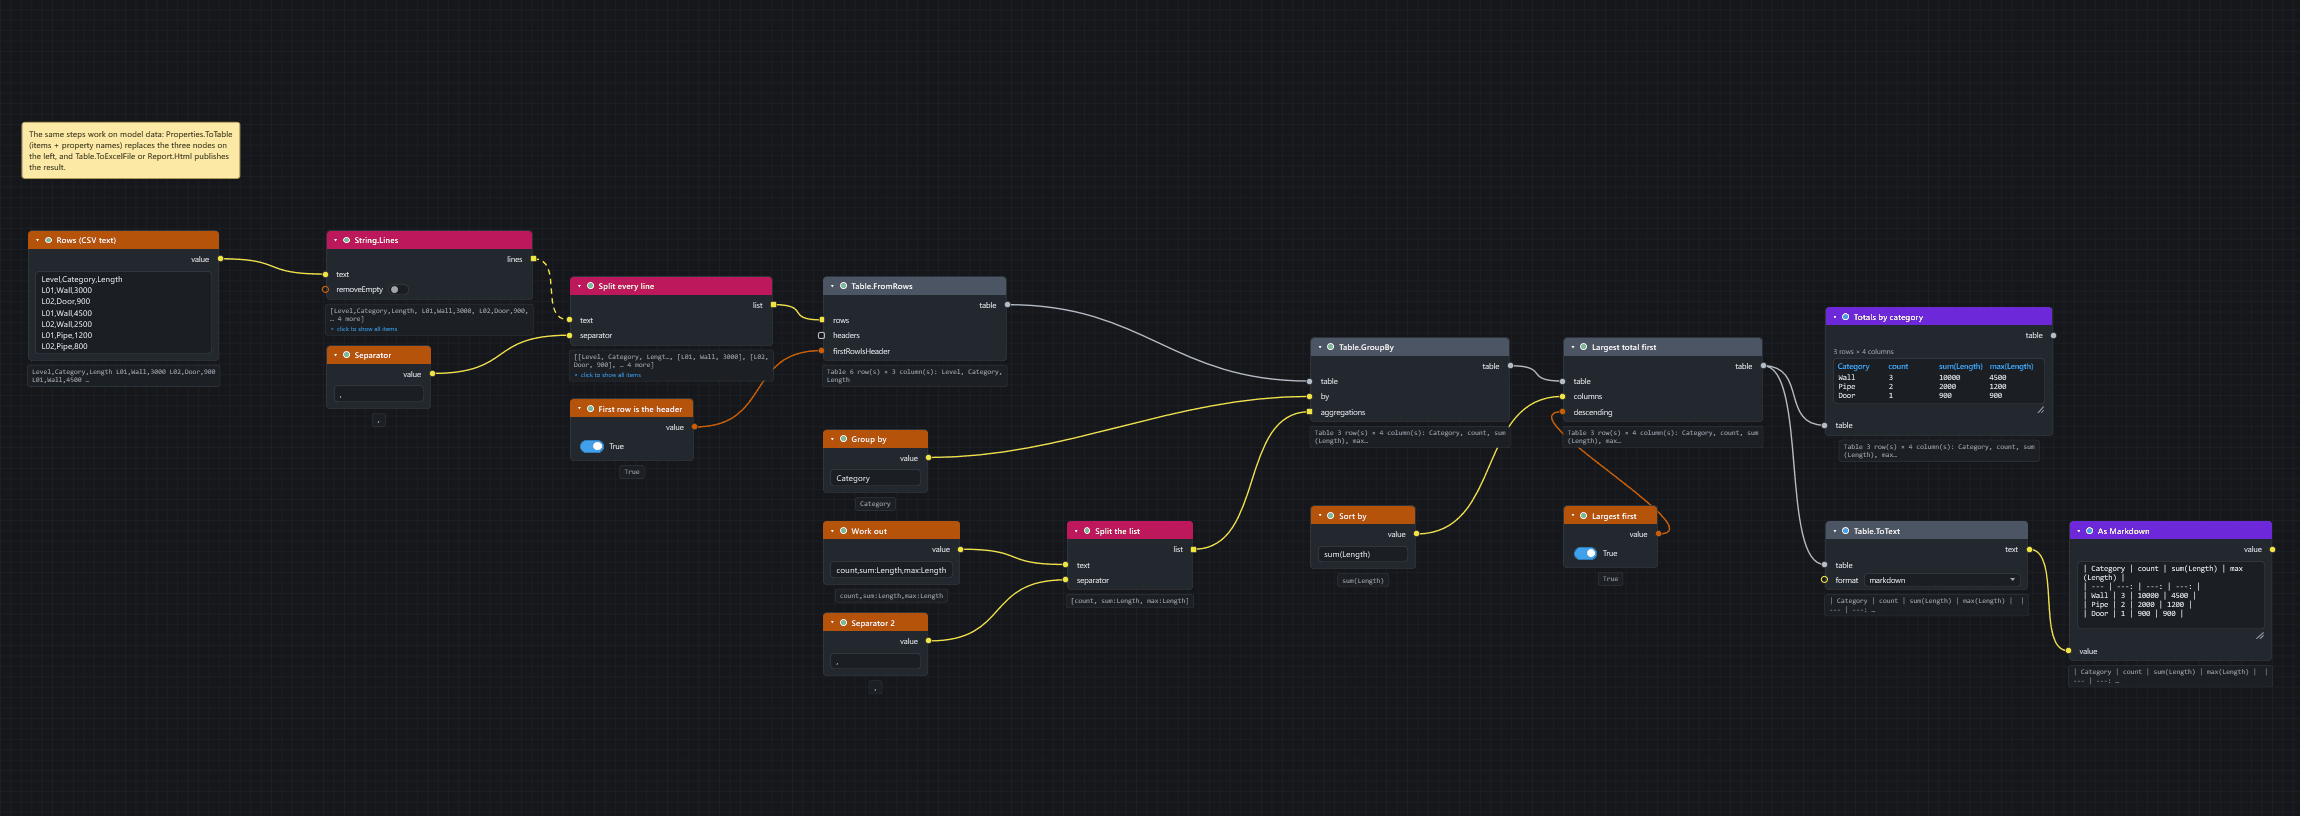
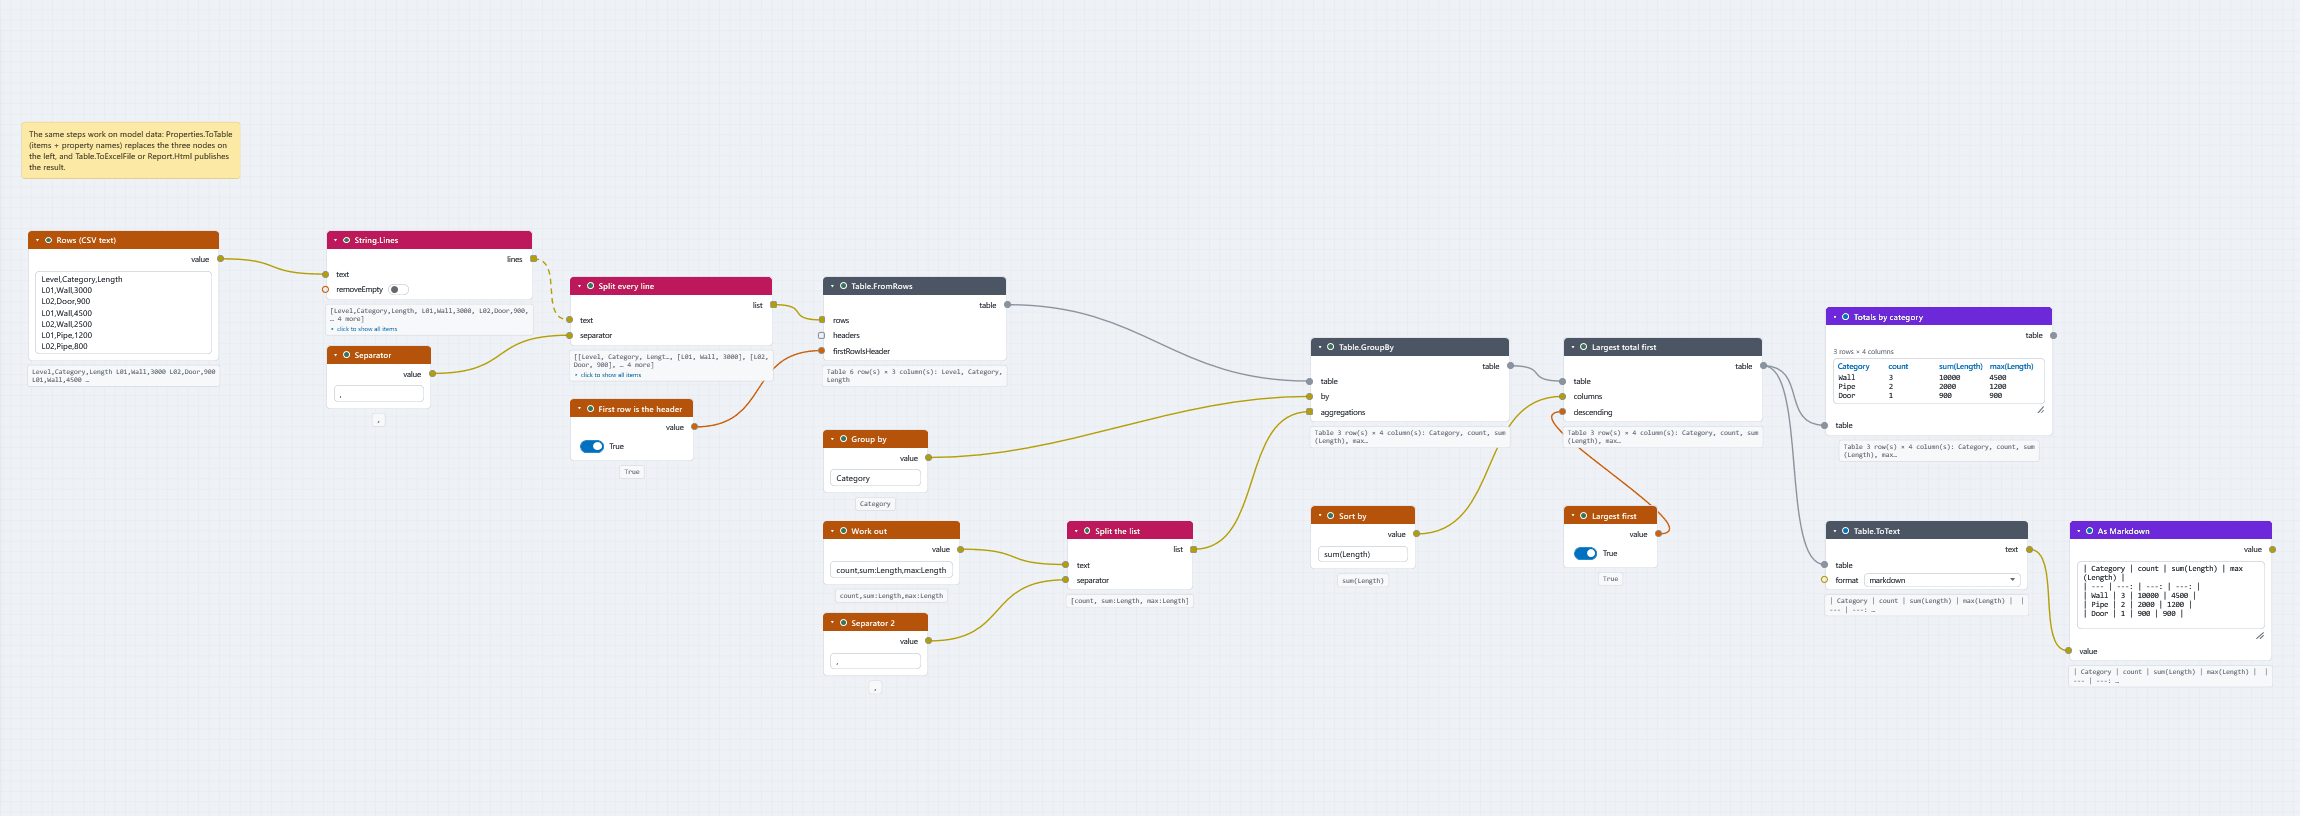
| Table Summary from Text | Pasted CSV text becomes a table (String.Lines, String.Split, Table.FromRows), grouped by category with a count, total and maximum (Table.GroupBy), sorted largest first (Table.Sort) and shown in a Watch Table and as Markdown (Table.ToText). Expected first row: Wall, 3, 10000, 4500. With model data the first three nodes are replaced by Properties.ToTable, and Table.ToExcelFile or Report.Html publishes the result. |
Older search nodes in some samples
Some samples were made before Search.ByProperty existed and use the older search nodes Search.ByPropertyValue and Search.ByPropertyContains. They are retired: they no longer appear in the library, but old graphs keep loading and running. In a graph you build now, use Search.ByProperty.
Searching, colouring and exporting
| Sample | What it does |
|---|---|
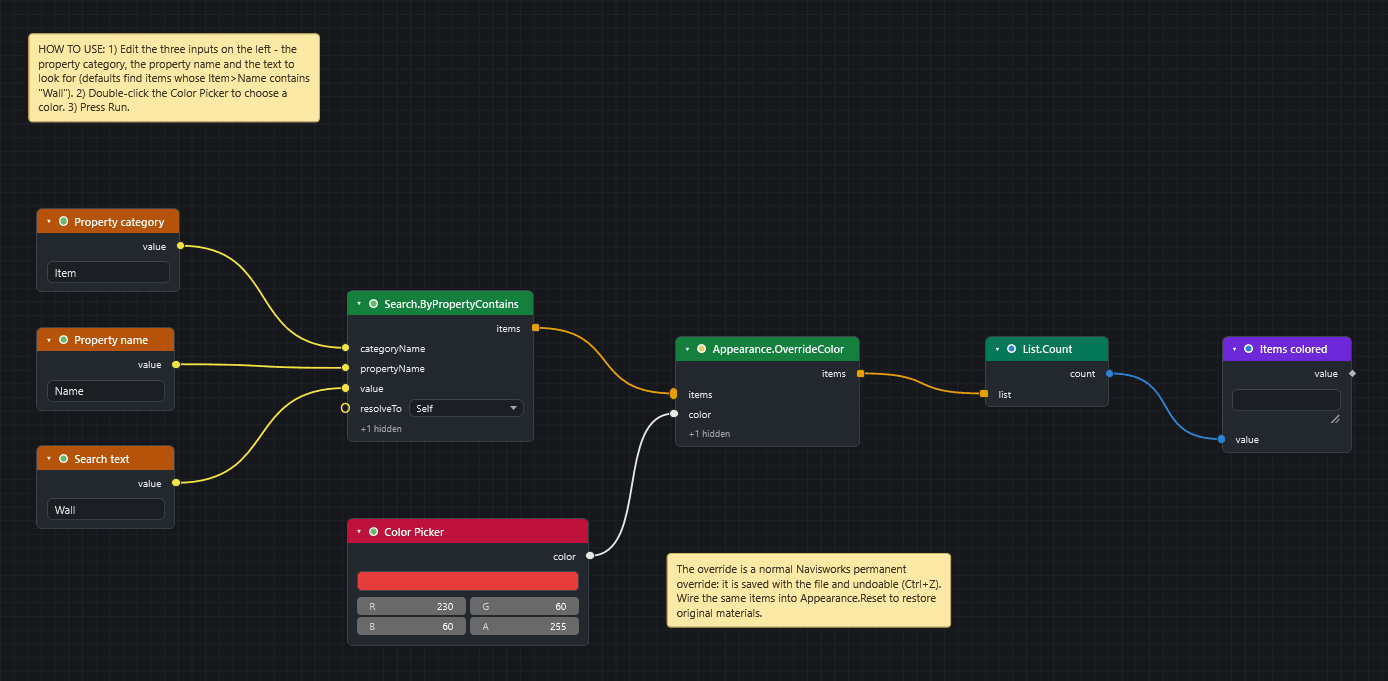
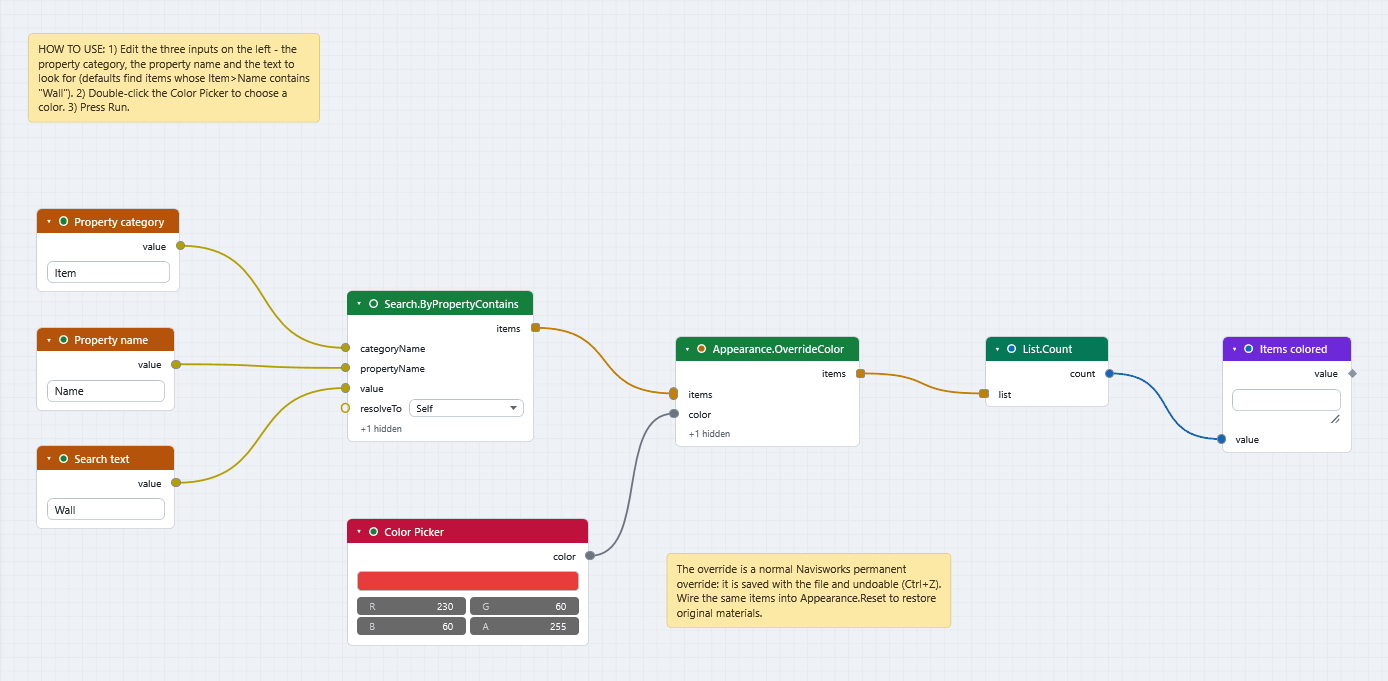
| Color Elements by Property | Search.ByProperty finds every item whose property contains a text (default: Item ▸ Name contains "Wall") and Appearance.OverrideColor paints it; List.Count reports how many. |
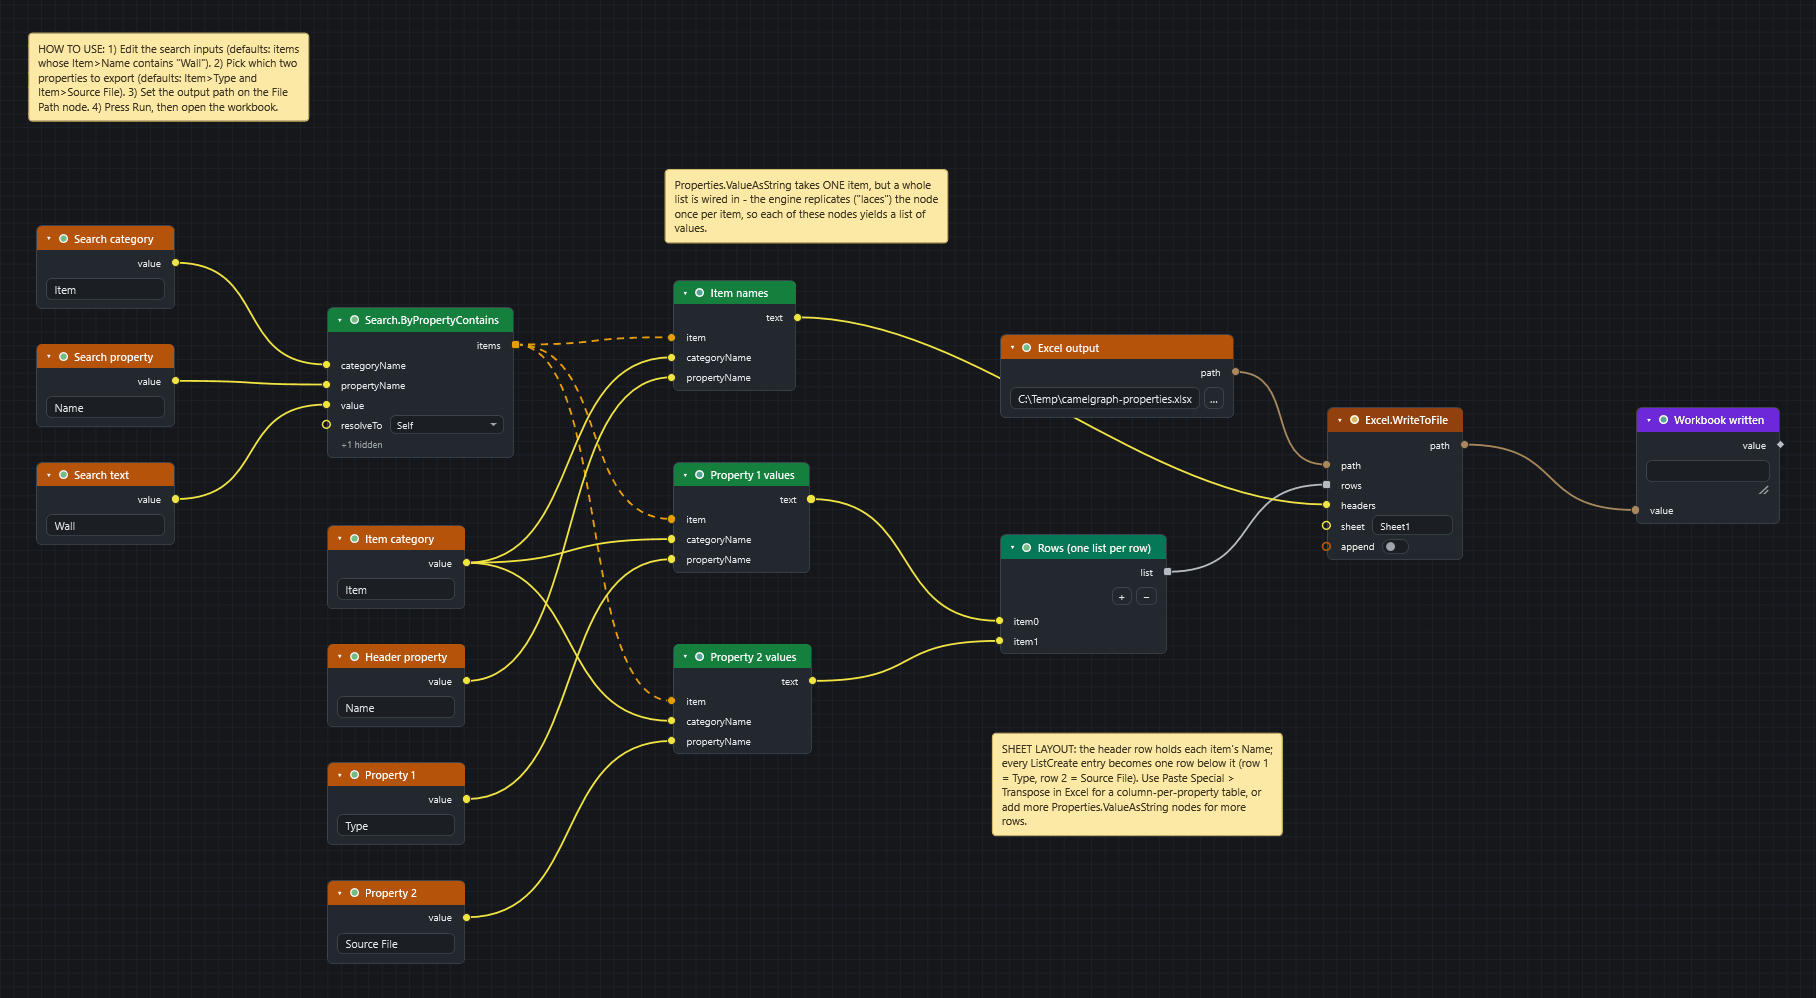
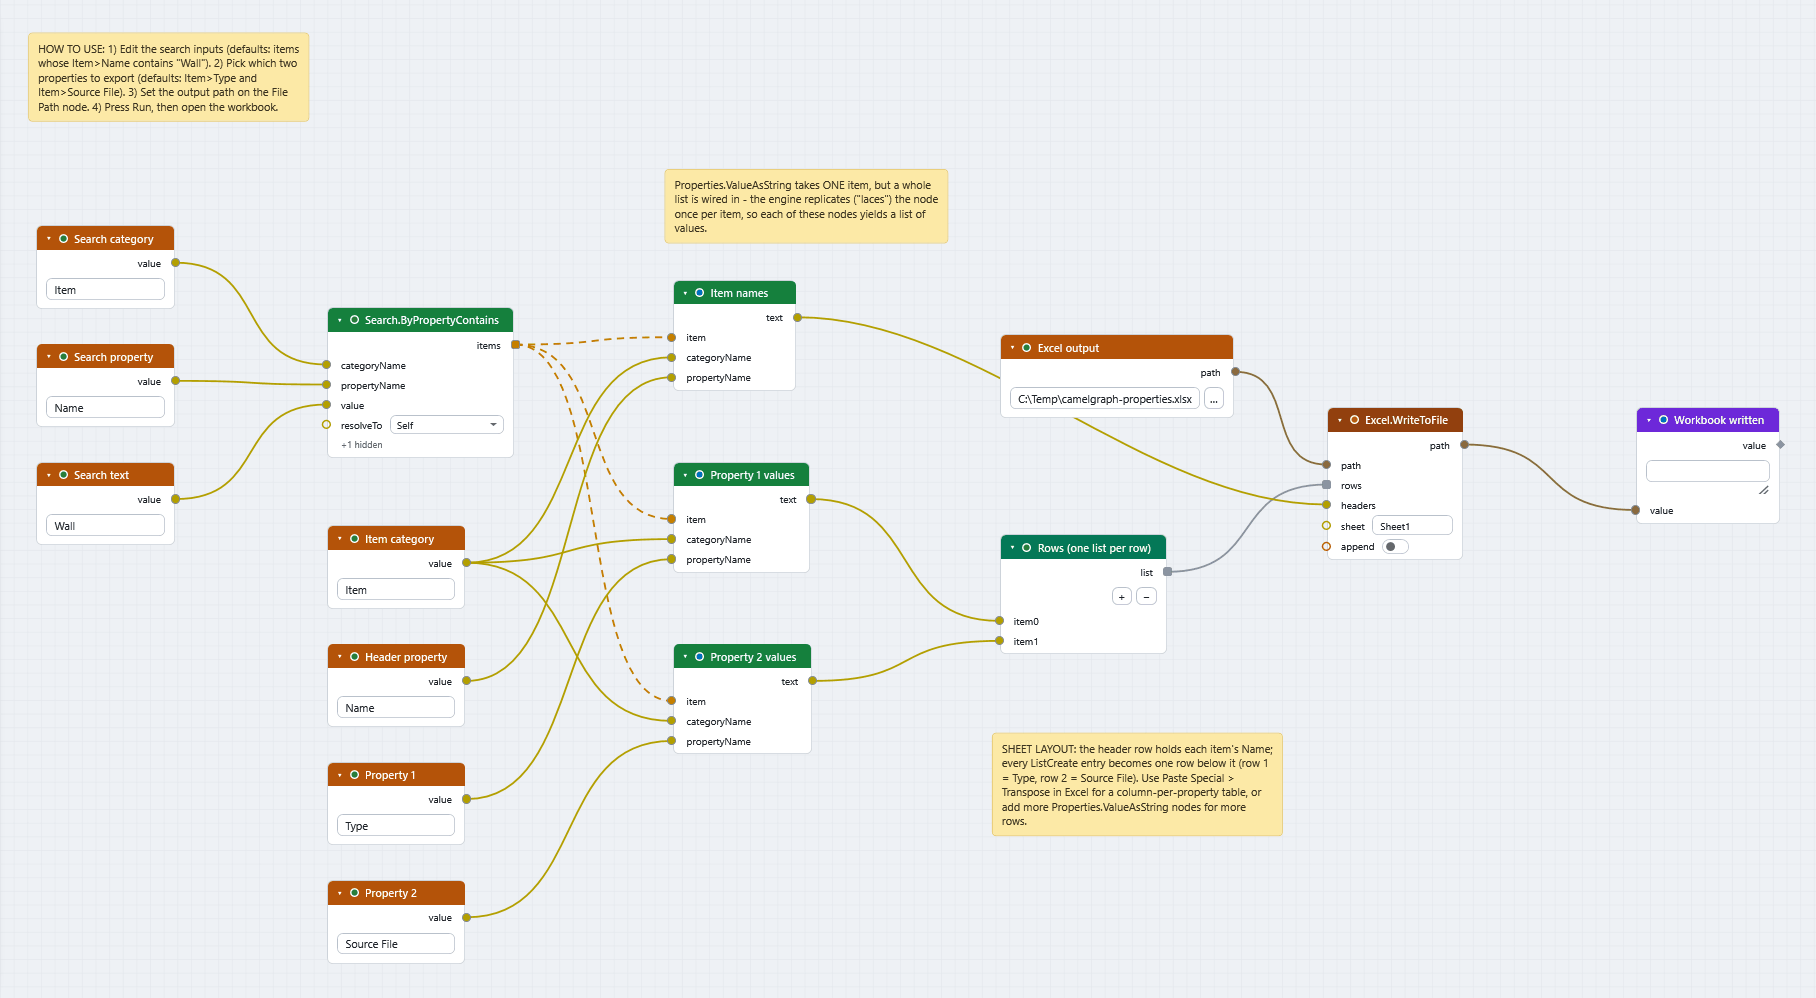
| Export Properties to Excel | Finds items, reads three properties of each with Properties.ValueAsString and writes a worksheet with Excel.WriteToFile. Item names become the header row; replication turns the single-item property node into a per-item list. |
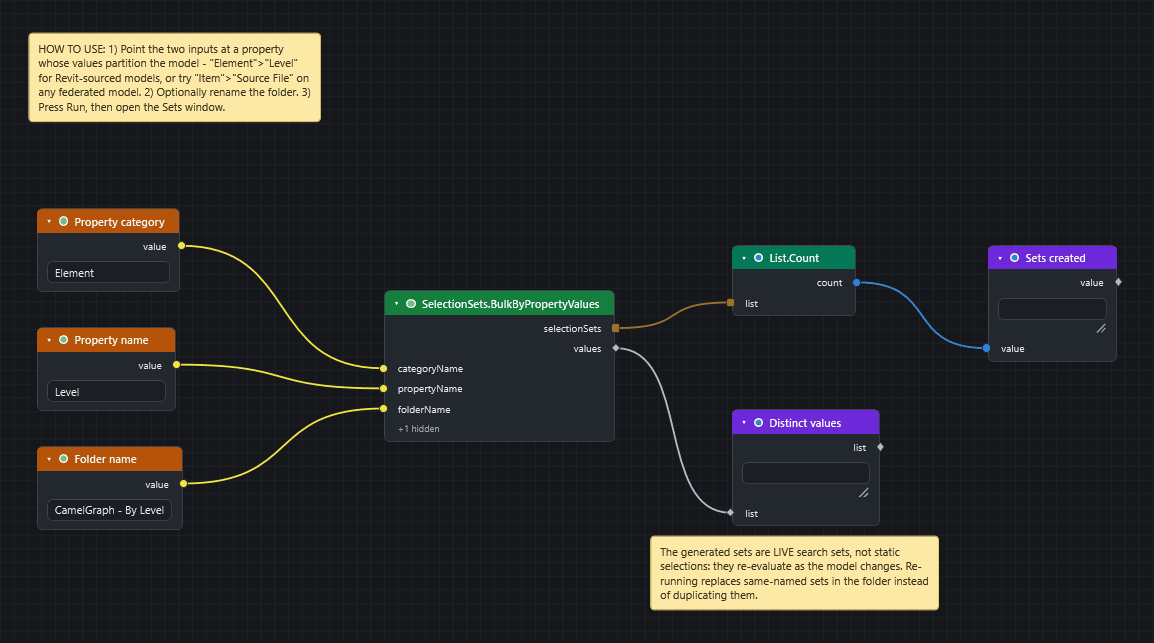
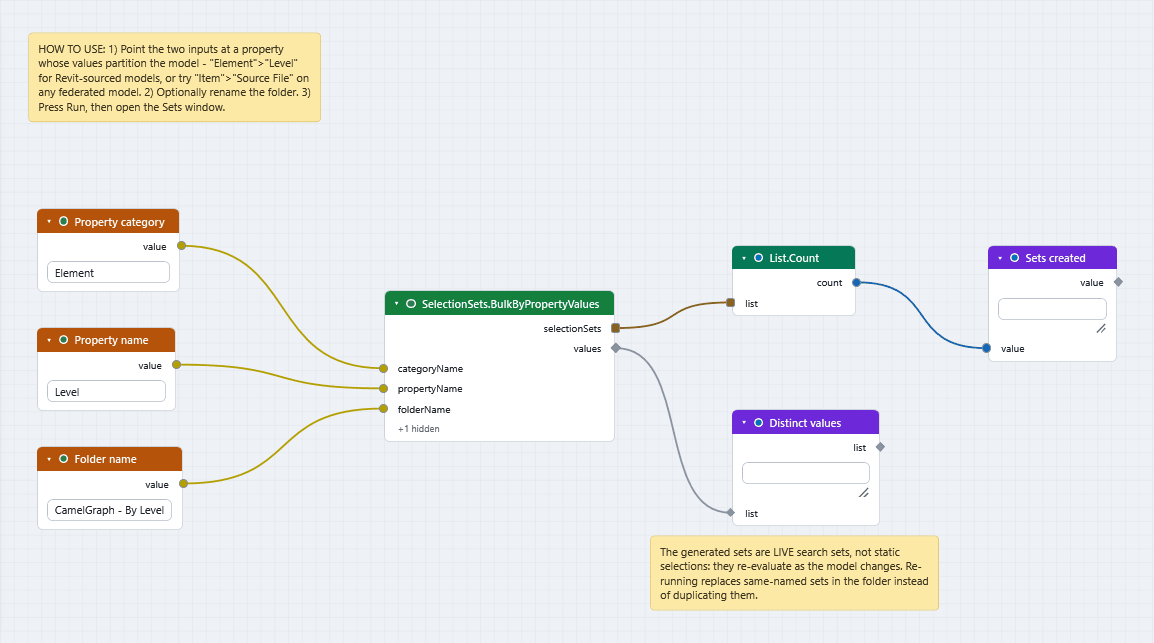
| Bulk Selection Sets from Values | SelectionSets.BulkByPropertyValues makes one live search set per distinct value of a property (default: Element ▸ Level), filed under a folder in the Sets window. |
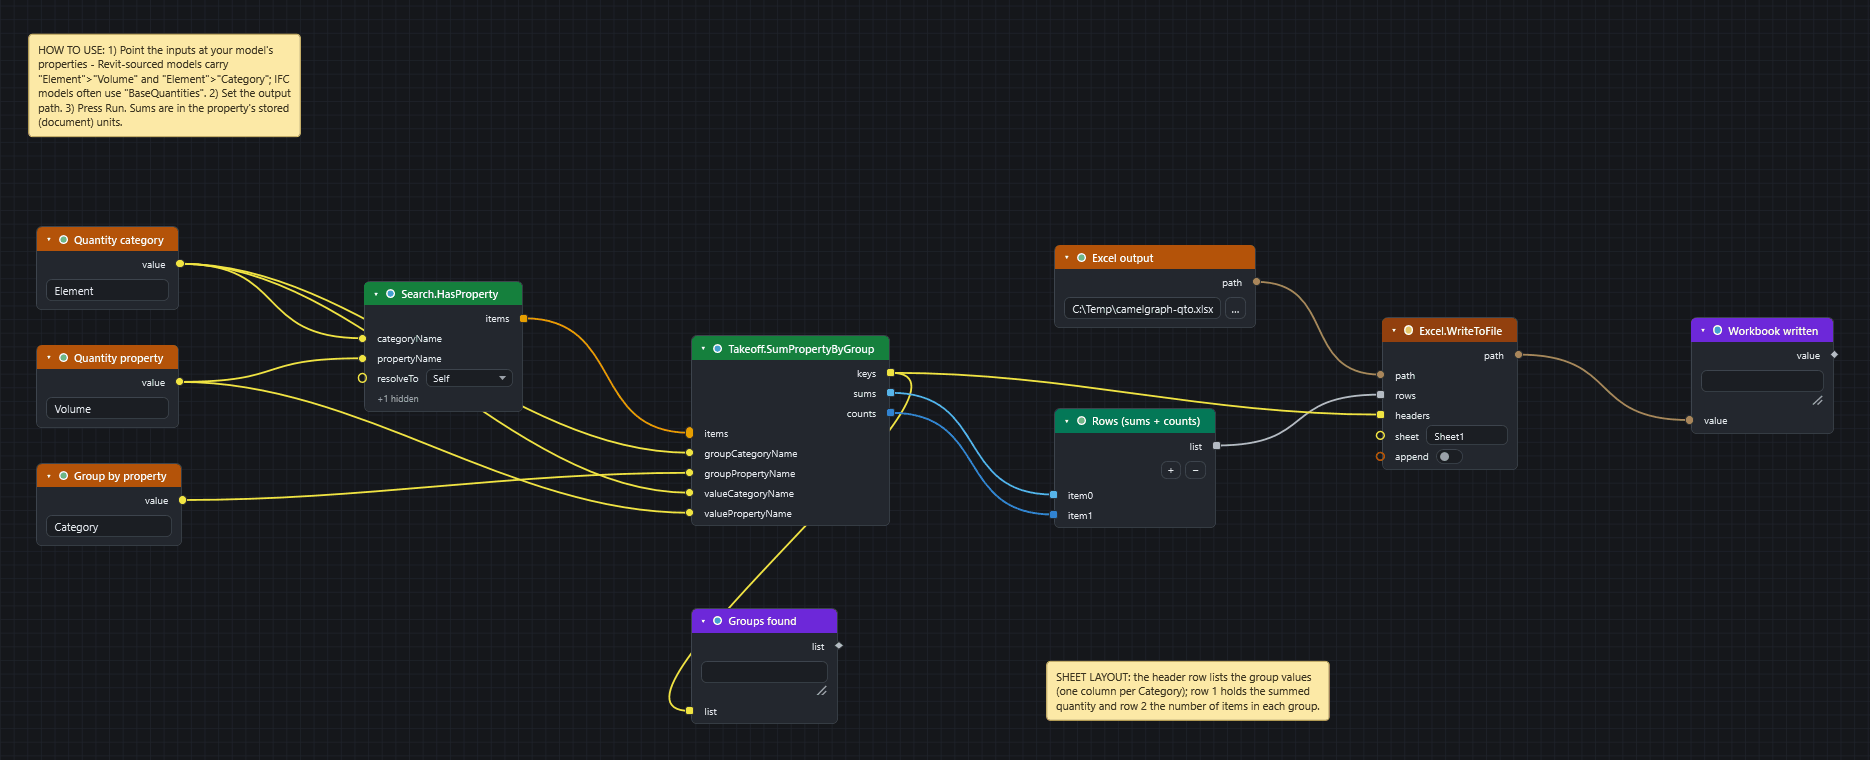
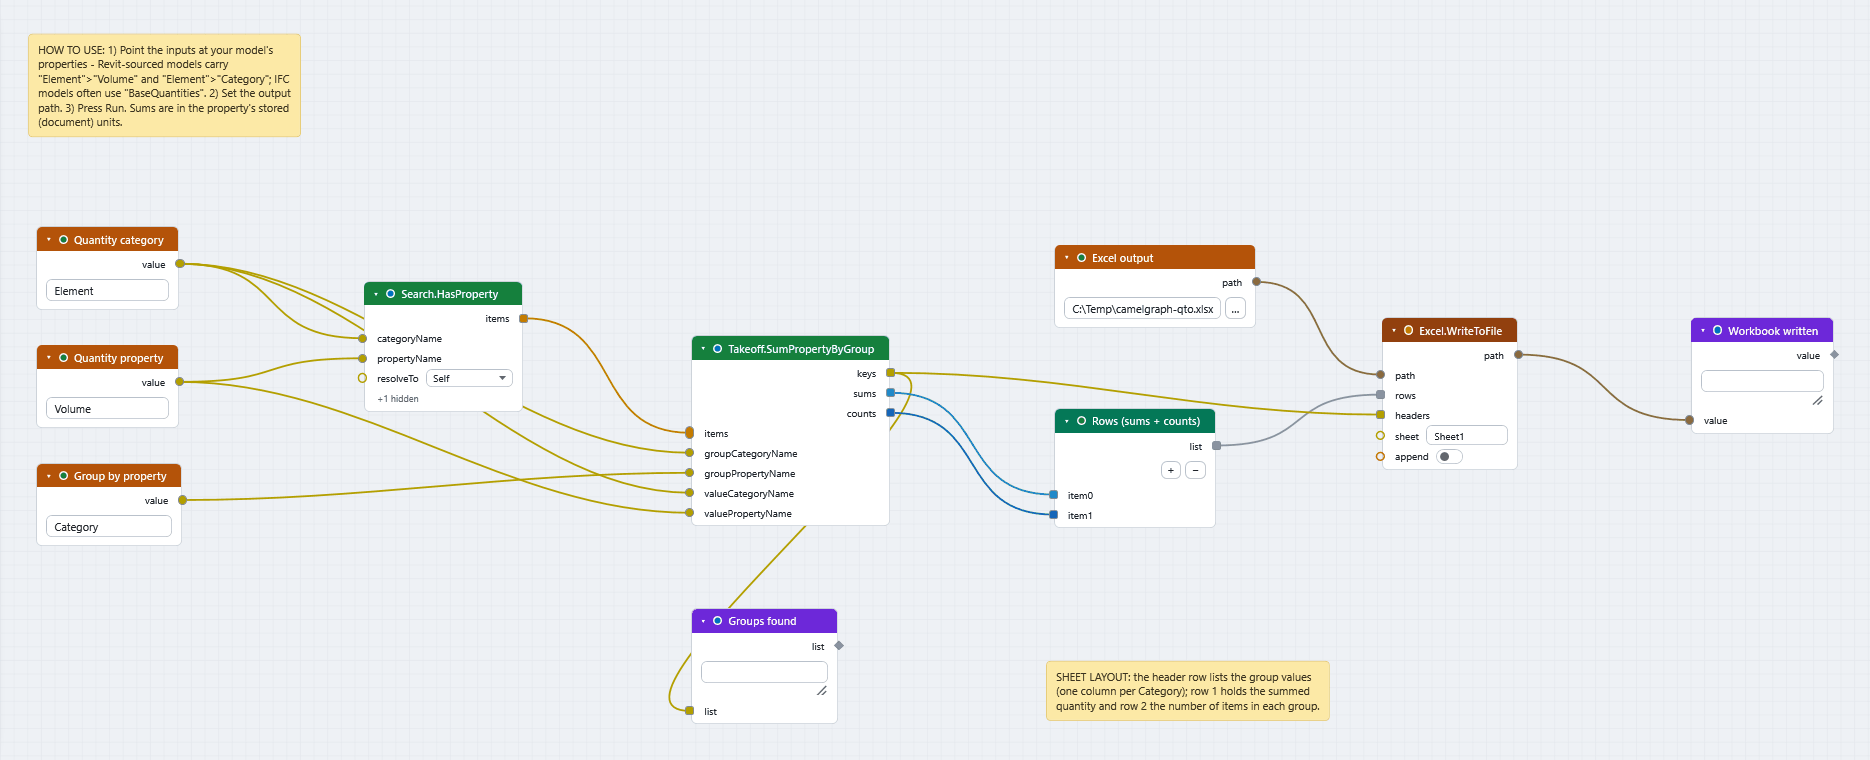
| QTO Rollup by Category | Search.HasProperty finds items, Takeoff.SumPropertyByGroup sums a numeric property (default: Element ▸ Volume) grouped by another (default: Element ▸ Category) and Excel.WriteToFile writes the rollup. |
Clash
| Sample | What it does |
|---|---|
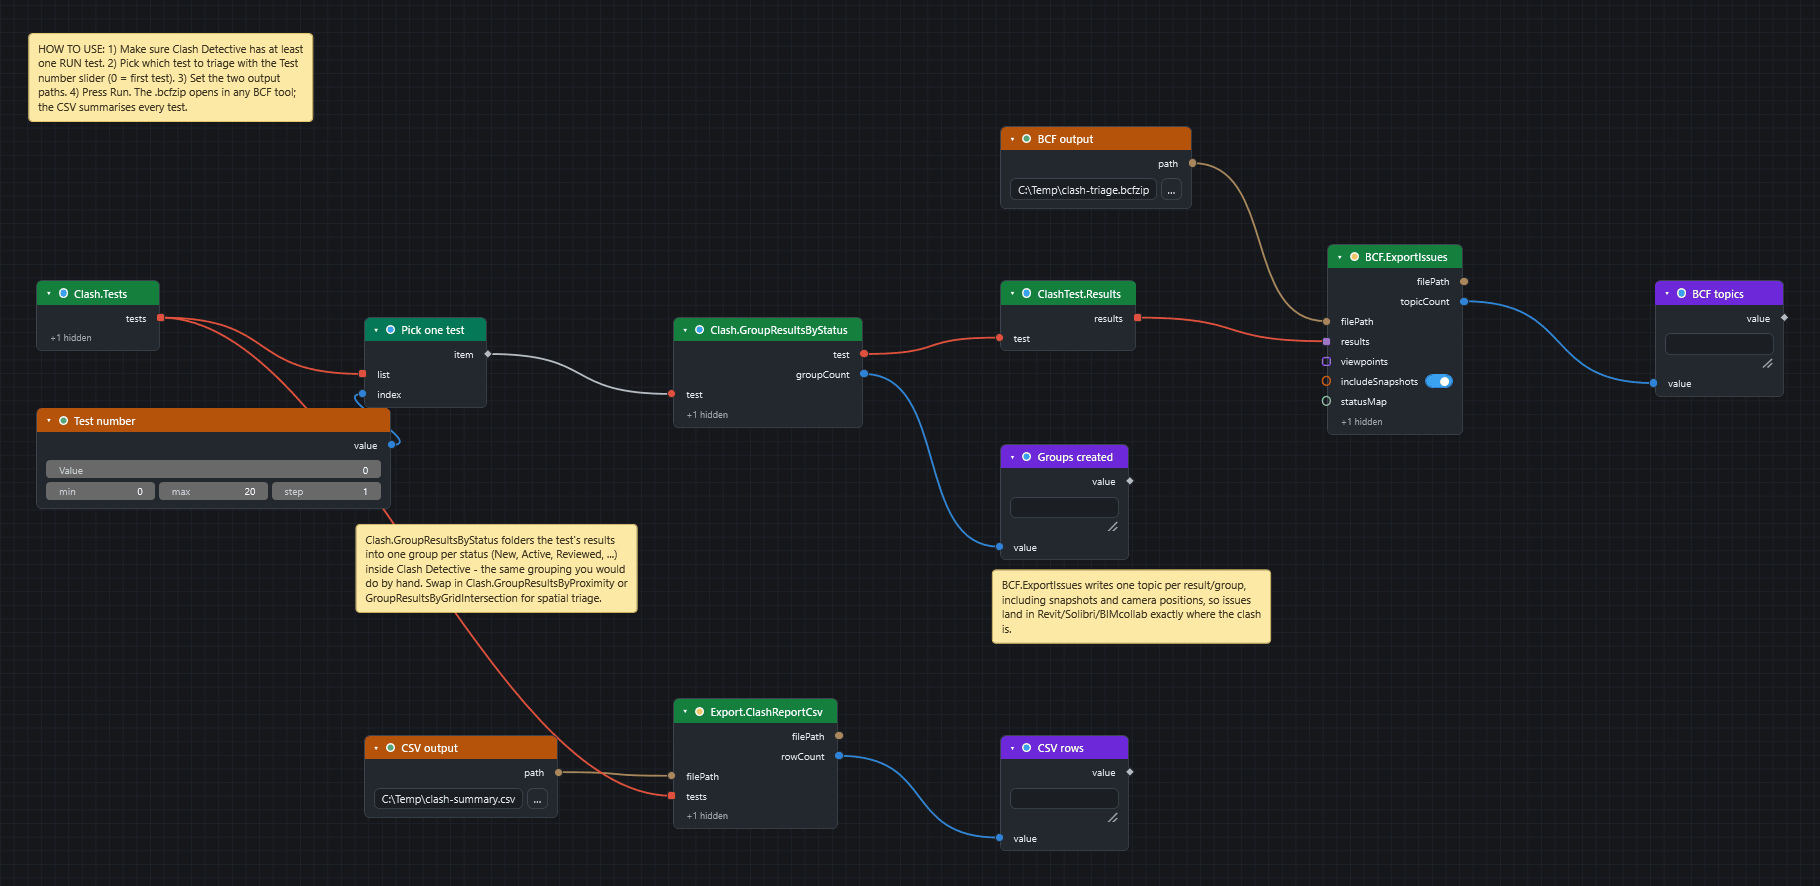
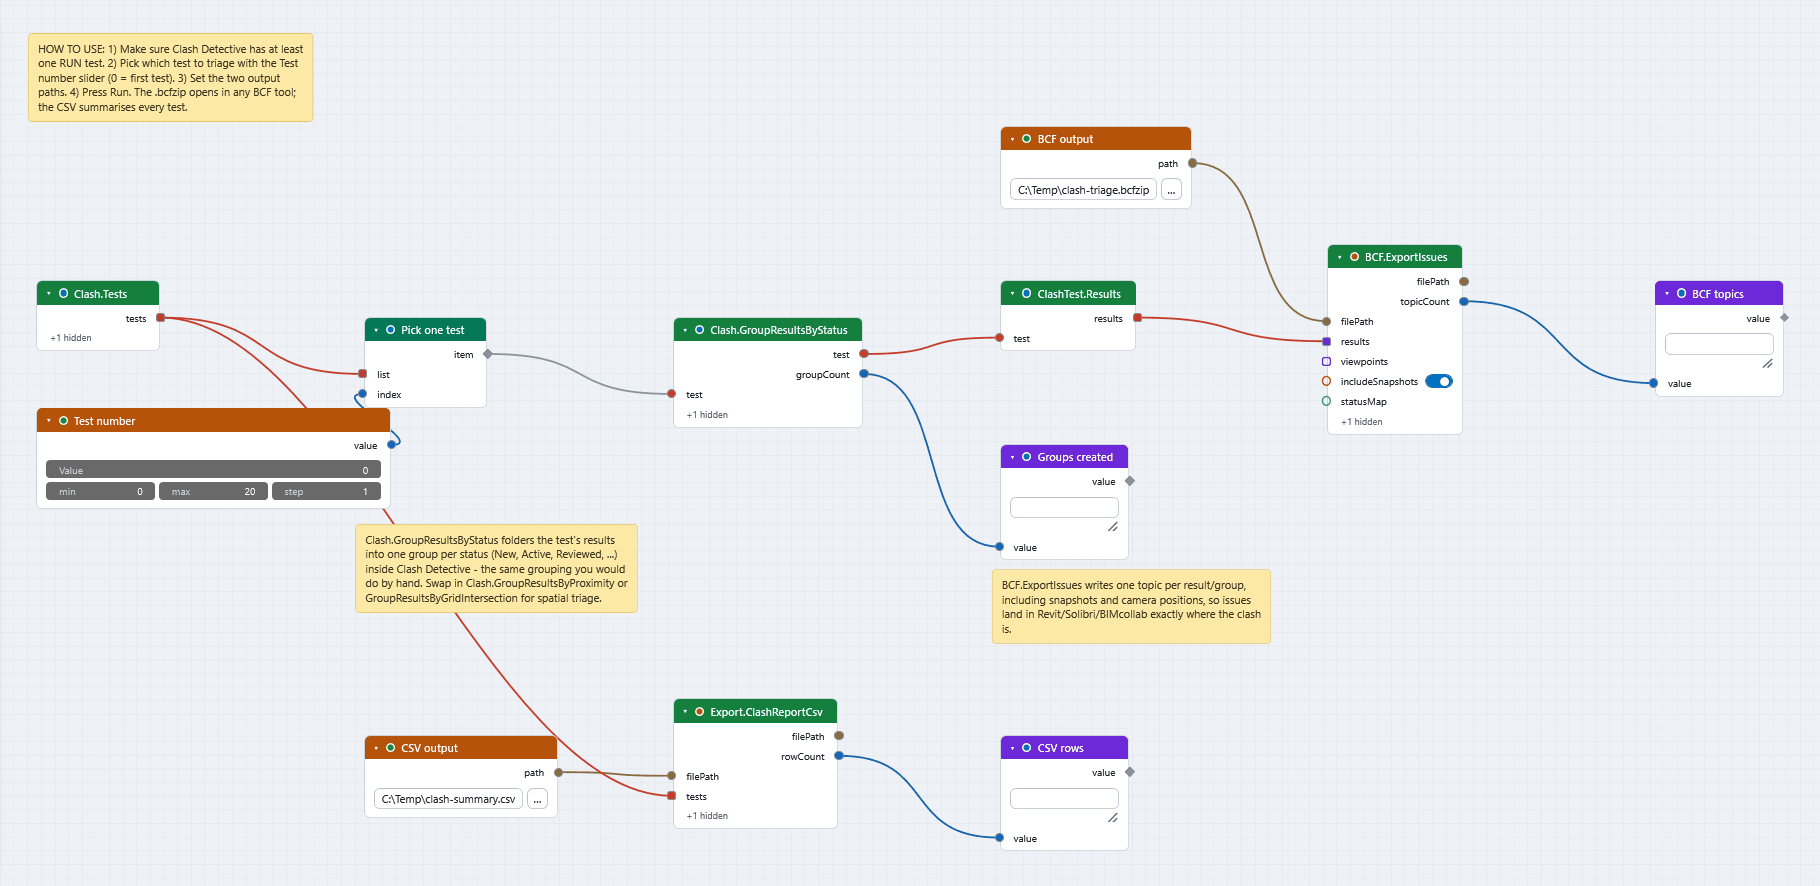
| Clash Triage and BCF Export | Clash.Tests, List.GetItemAtIndex, Clash.GroupResultsByStatus, ClashTest.Results and BCF.ExportIssues, plus Export.ClashReportCsv for a CSV summary of every test. Needs Navisworks Manage. |
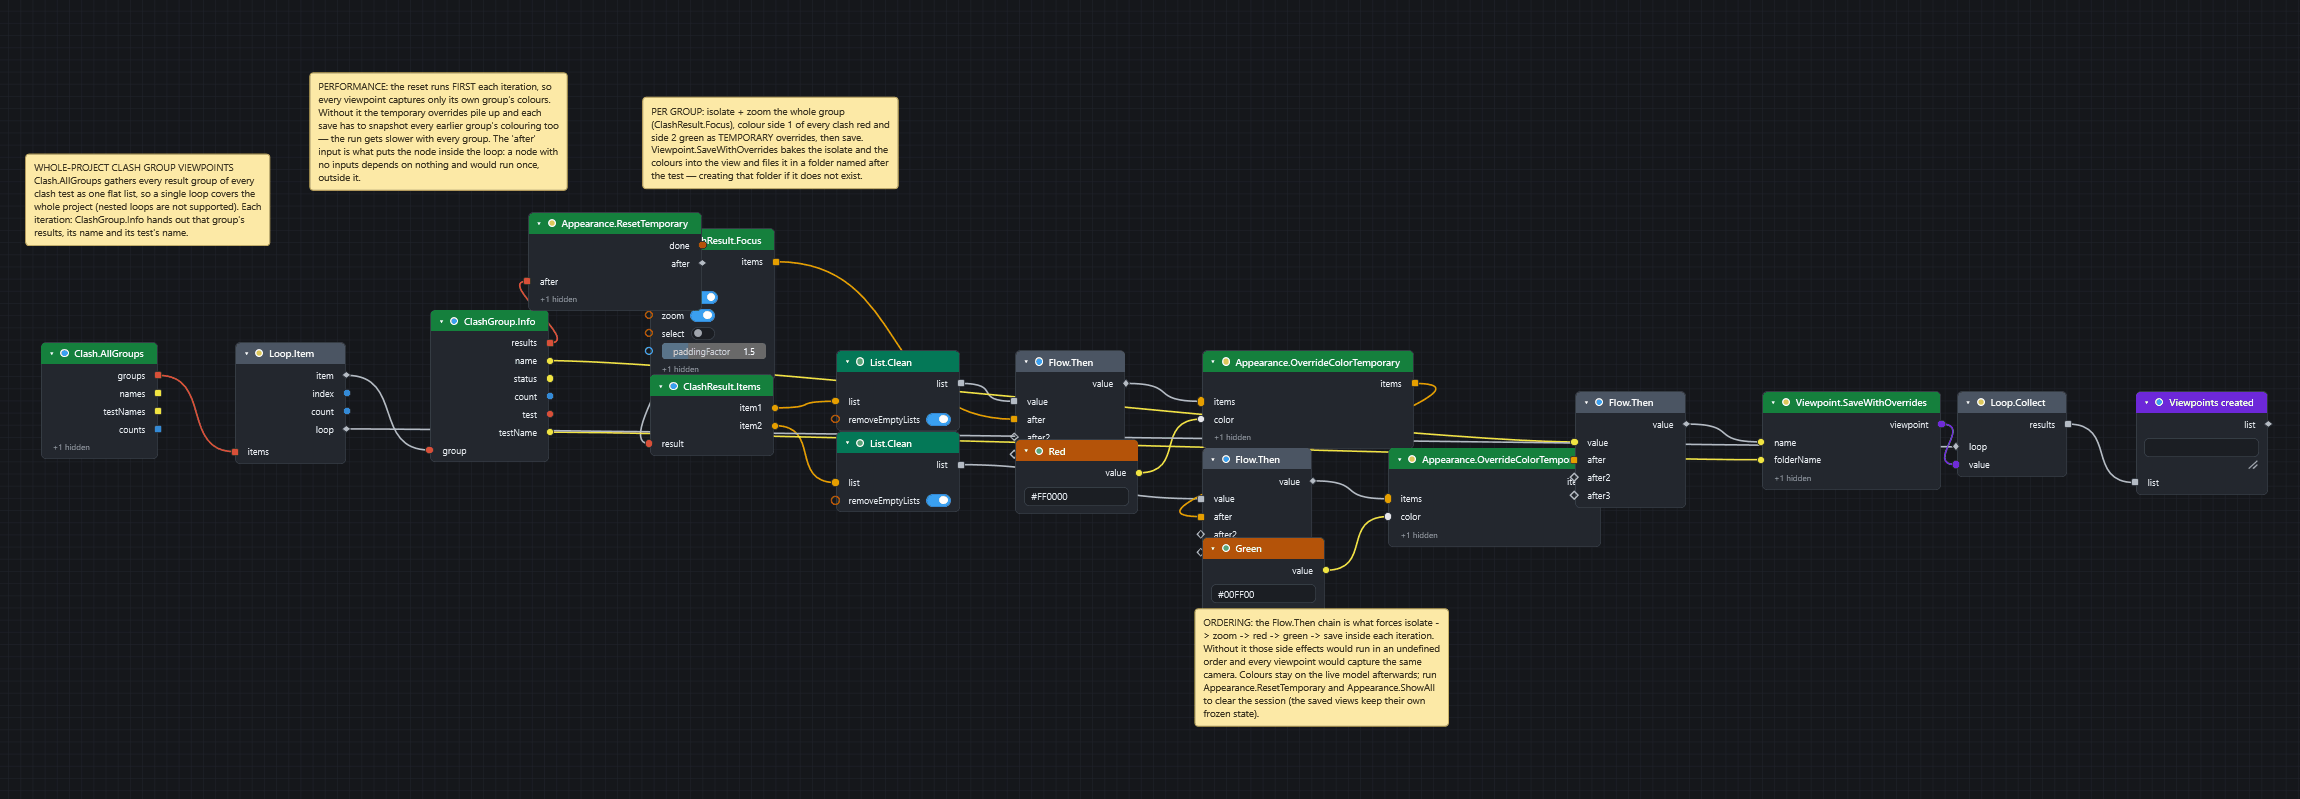
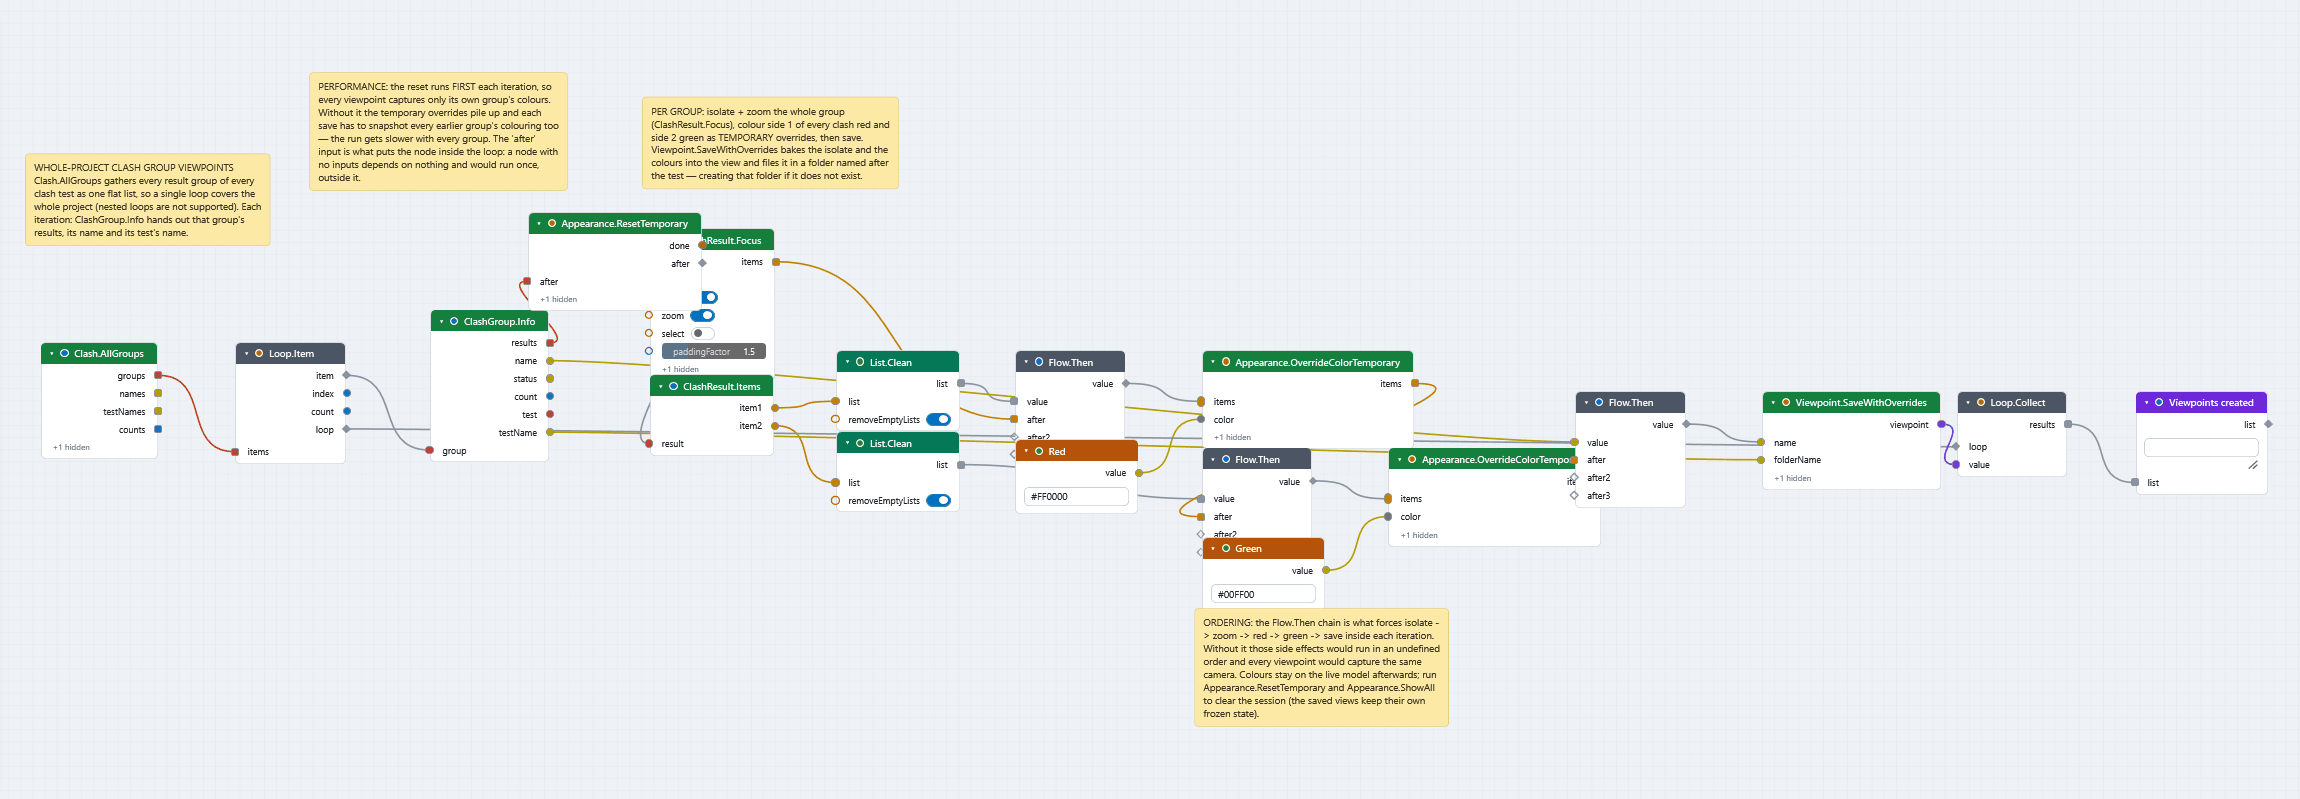
| Clash Group Viewpoints per Test | For every result group of every clash test: isolates the group's clashing elements, colours each clash's first element red and its second green (temporary overrides) and saves a viewpoint named after the group, in a folder named after its test. Needs an open model with clash tests that have run and have groups. Flow.Then pins the order isolate, zoom, red, green, save inside each pass of the loop. |
Viewpoints and loops
| Sample | What it does |
|---|---|
| Isolated Viewpoints per Item | The per-item loop built from reified actions: a search finds items, and a recipe (Action.Isolate, Action.ZoomTo, Action.SaveViewpoint) gathered with List.Create is replayed by Workflow.ForEach for every item. One saved viewpoint per element, framed on its own item and named from the item with the {name} template. |
| Spotlight Viewpoints per Item | The same loop for presentation: for each item the recipe ghosts the whole model, highlights the current item in a chosen colour, zooms to it and saves a viewpoint. The temporary overrides are captured into each viewpoint, so every view keeps its own look. |
| Isolated Viewpoints (Loop) | The same result built from ordinary nodes: Loop.Item and Loop.Collect bracket a body (Appearance.Isolate, Camera.ZoomToItems, Viewpoint.Save with bakeOverrides on; the file was saved with its earlier name, Viewpoint.SaveWithOverrides) that the engine re-runs once per item. Any subgraph between the two boundaries becomes a loop. |
| Section Box Viewpoints per Group | Clusters the current selection into touching groups with Proximity.Cluster, then for each group applies a section box from its combined bounding box (padded), zooms to the group and saves a viewpoint named "Group <n>" in the "Group Views" folder. The cluster tolerance is in metres and must be smaller than the space between separate groups. Needs a live Navisworks session. |
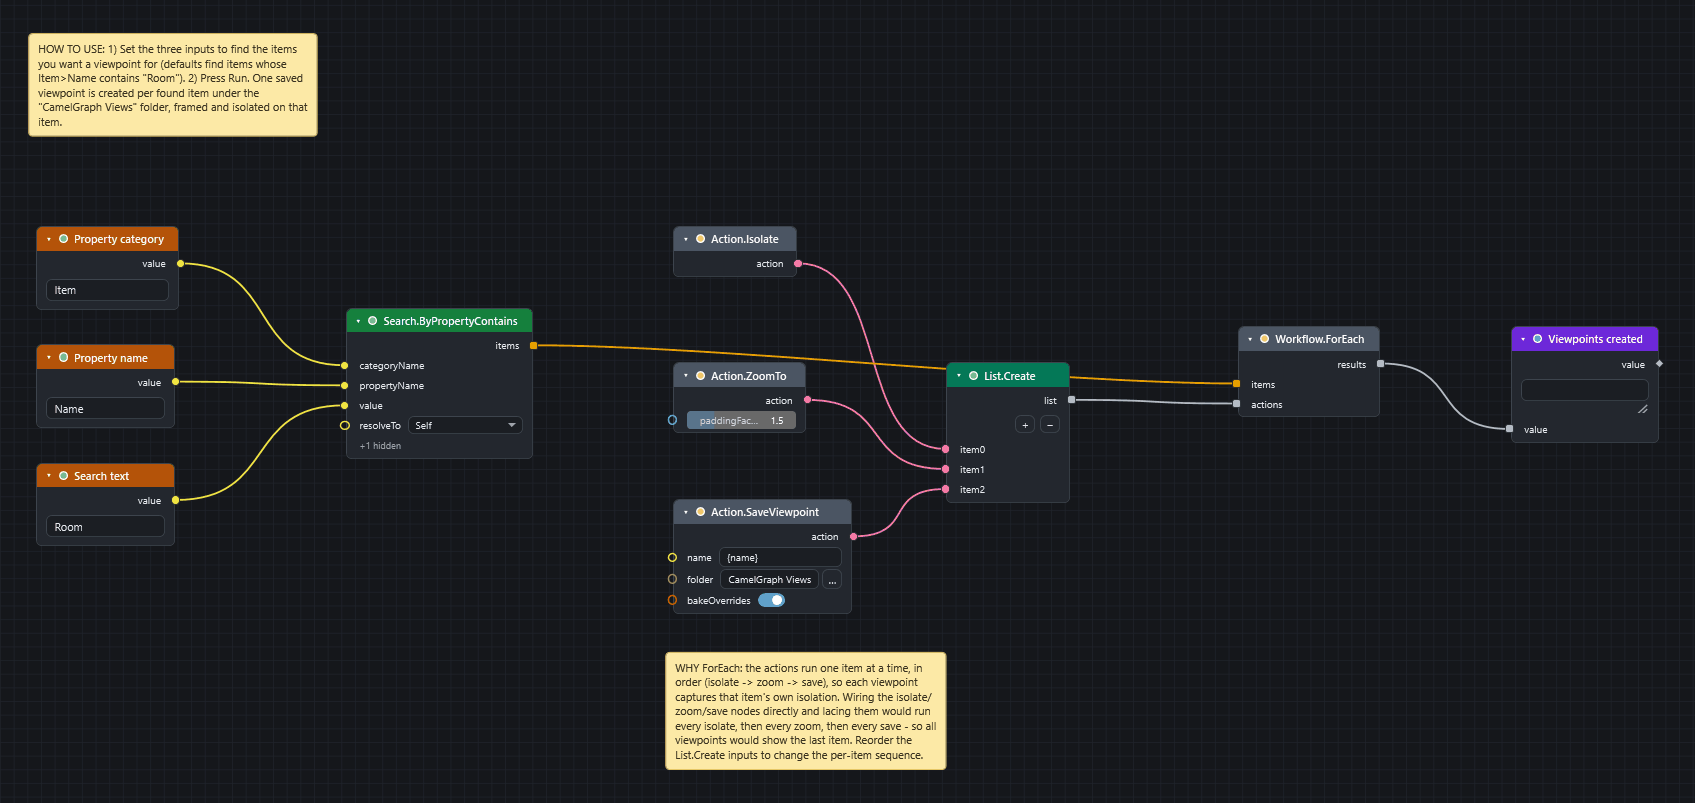
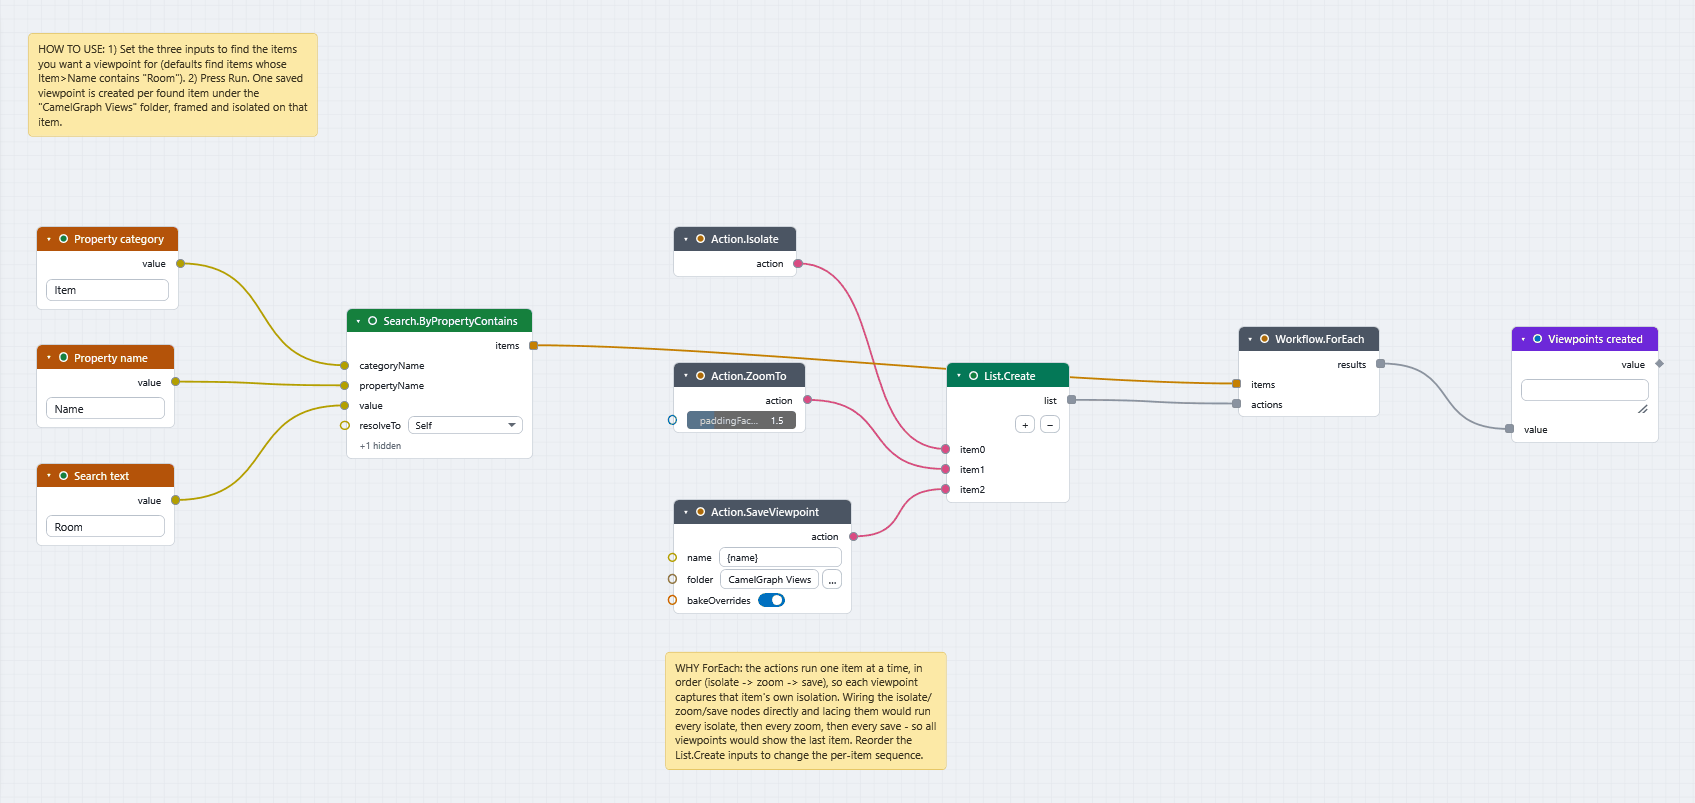
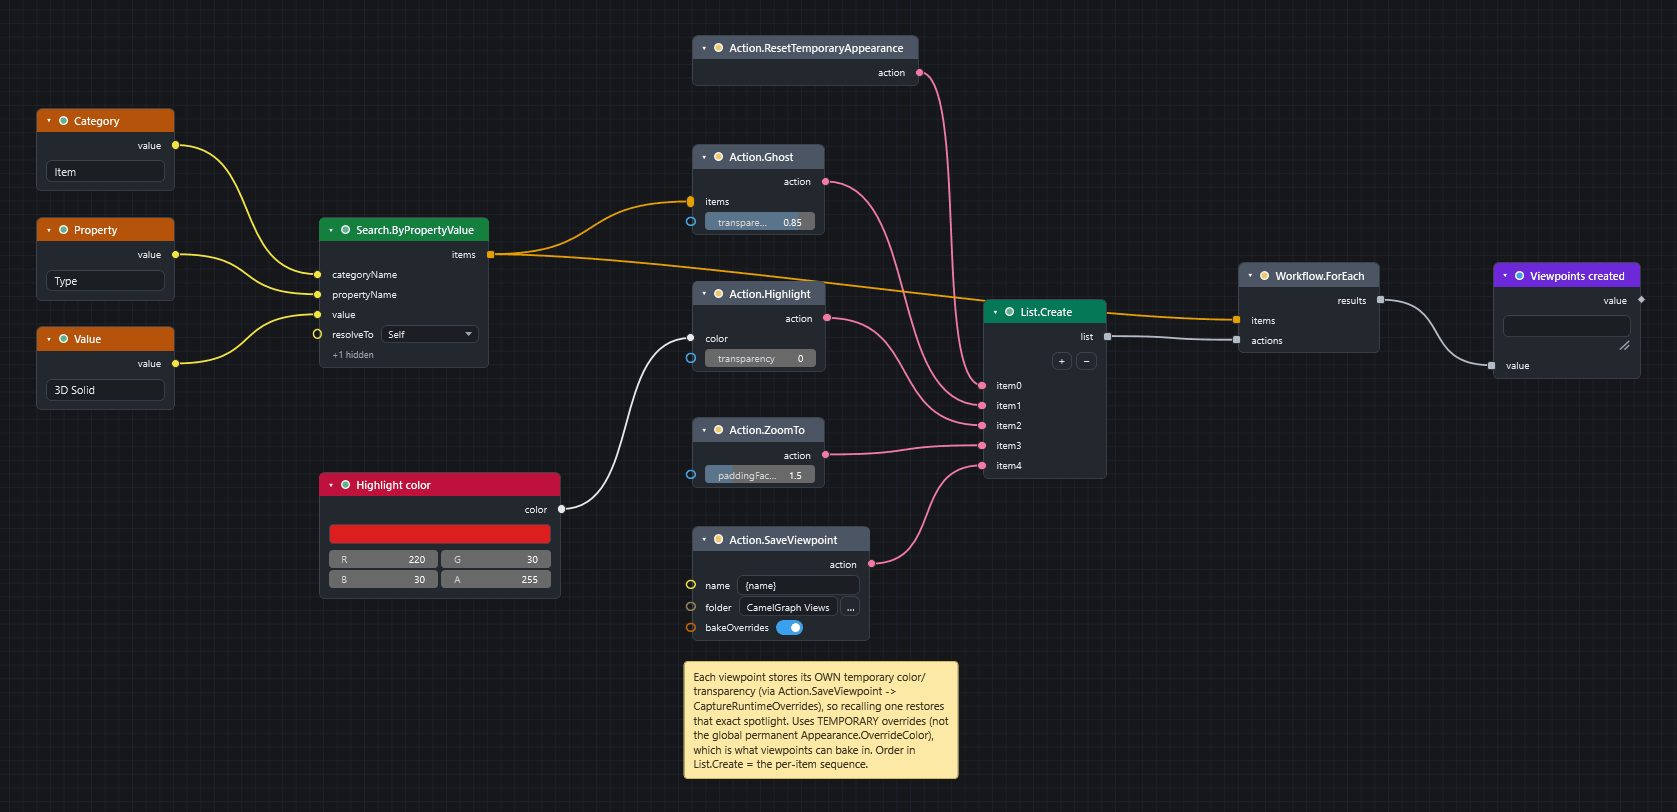
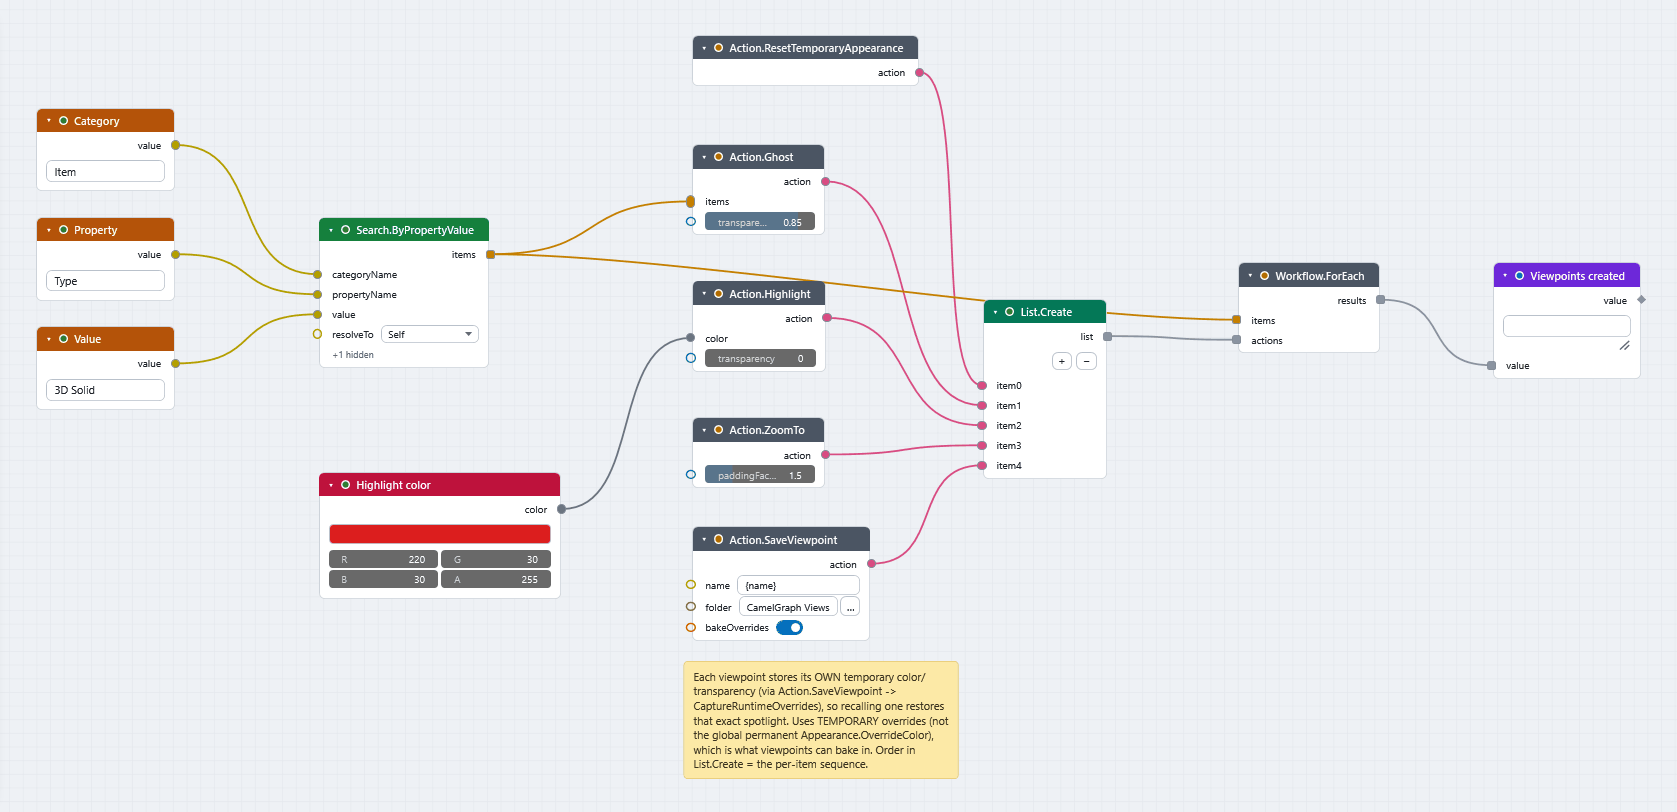
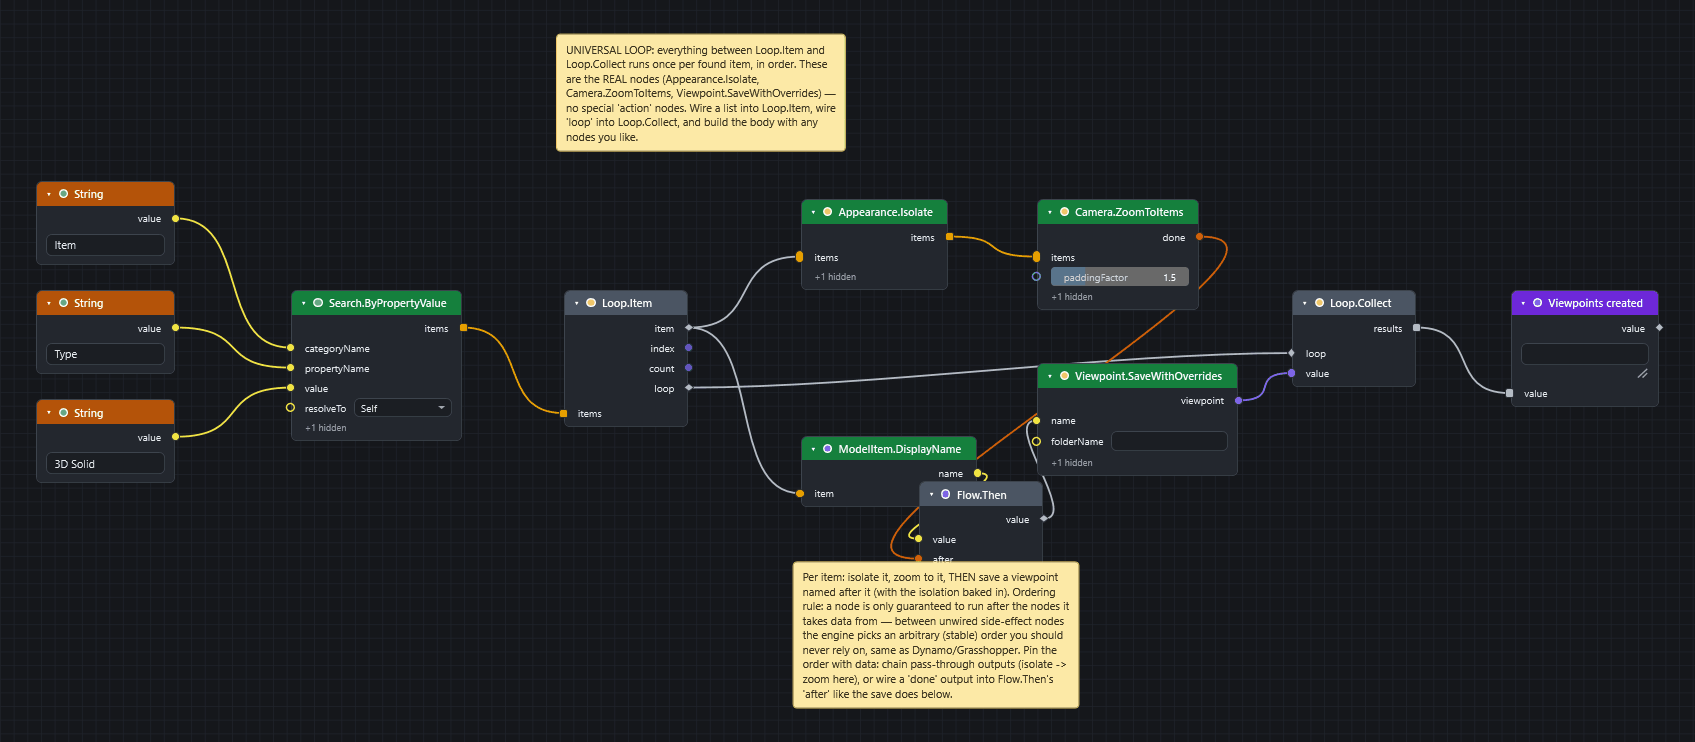
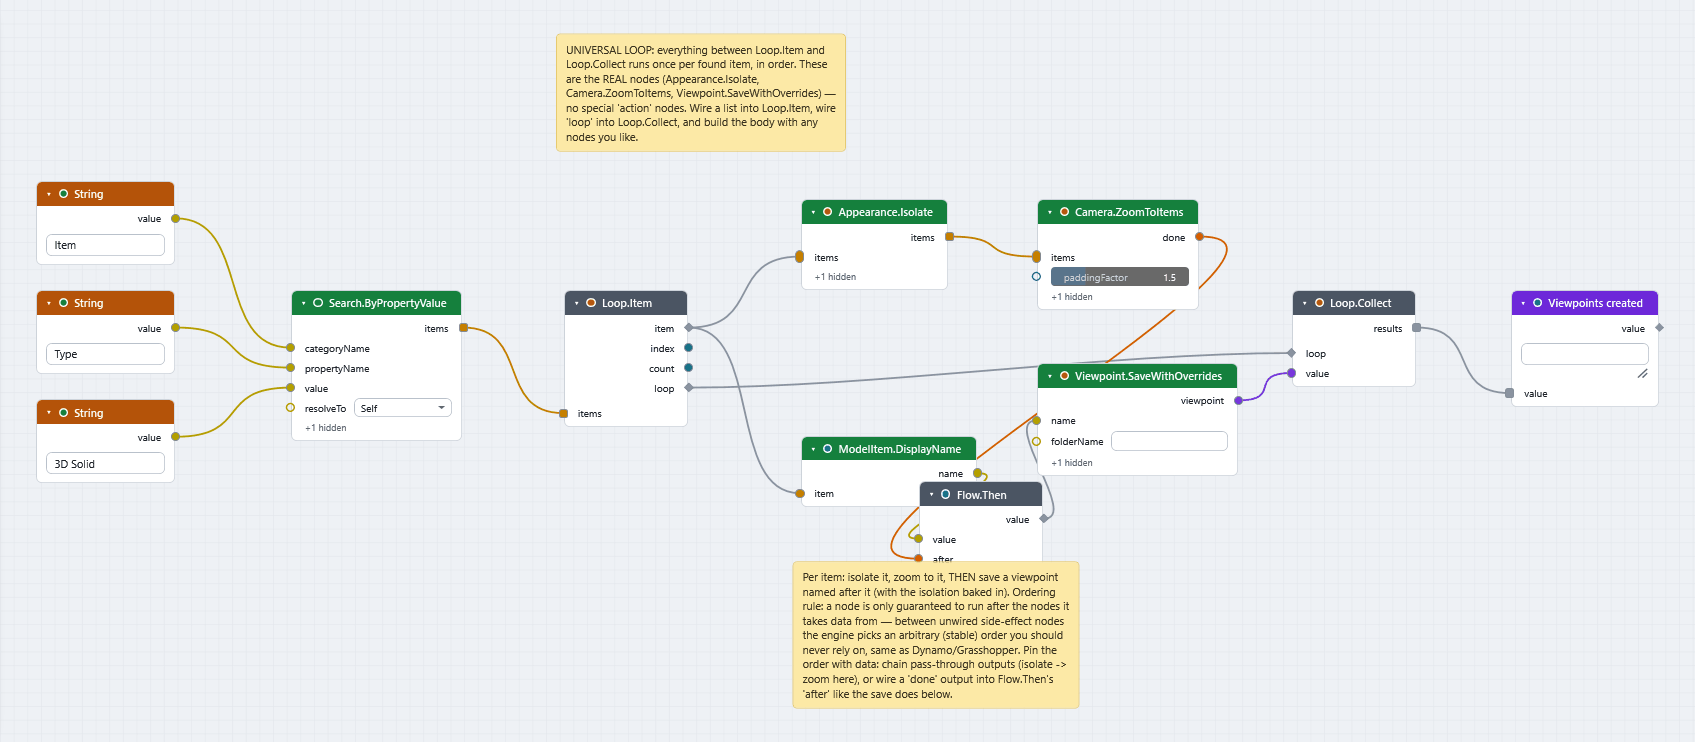
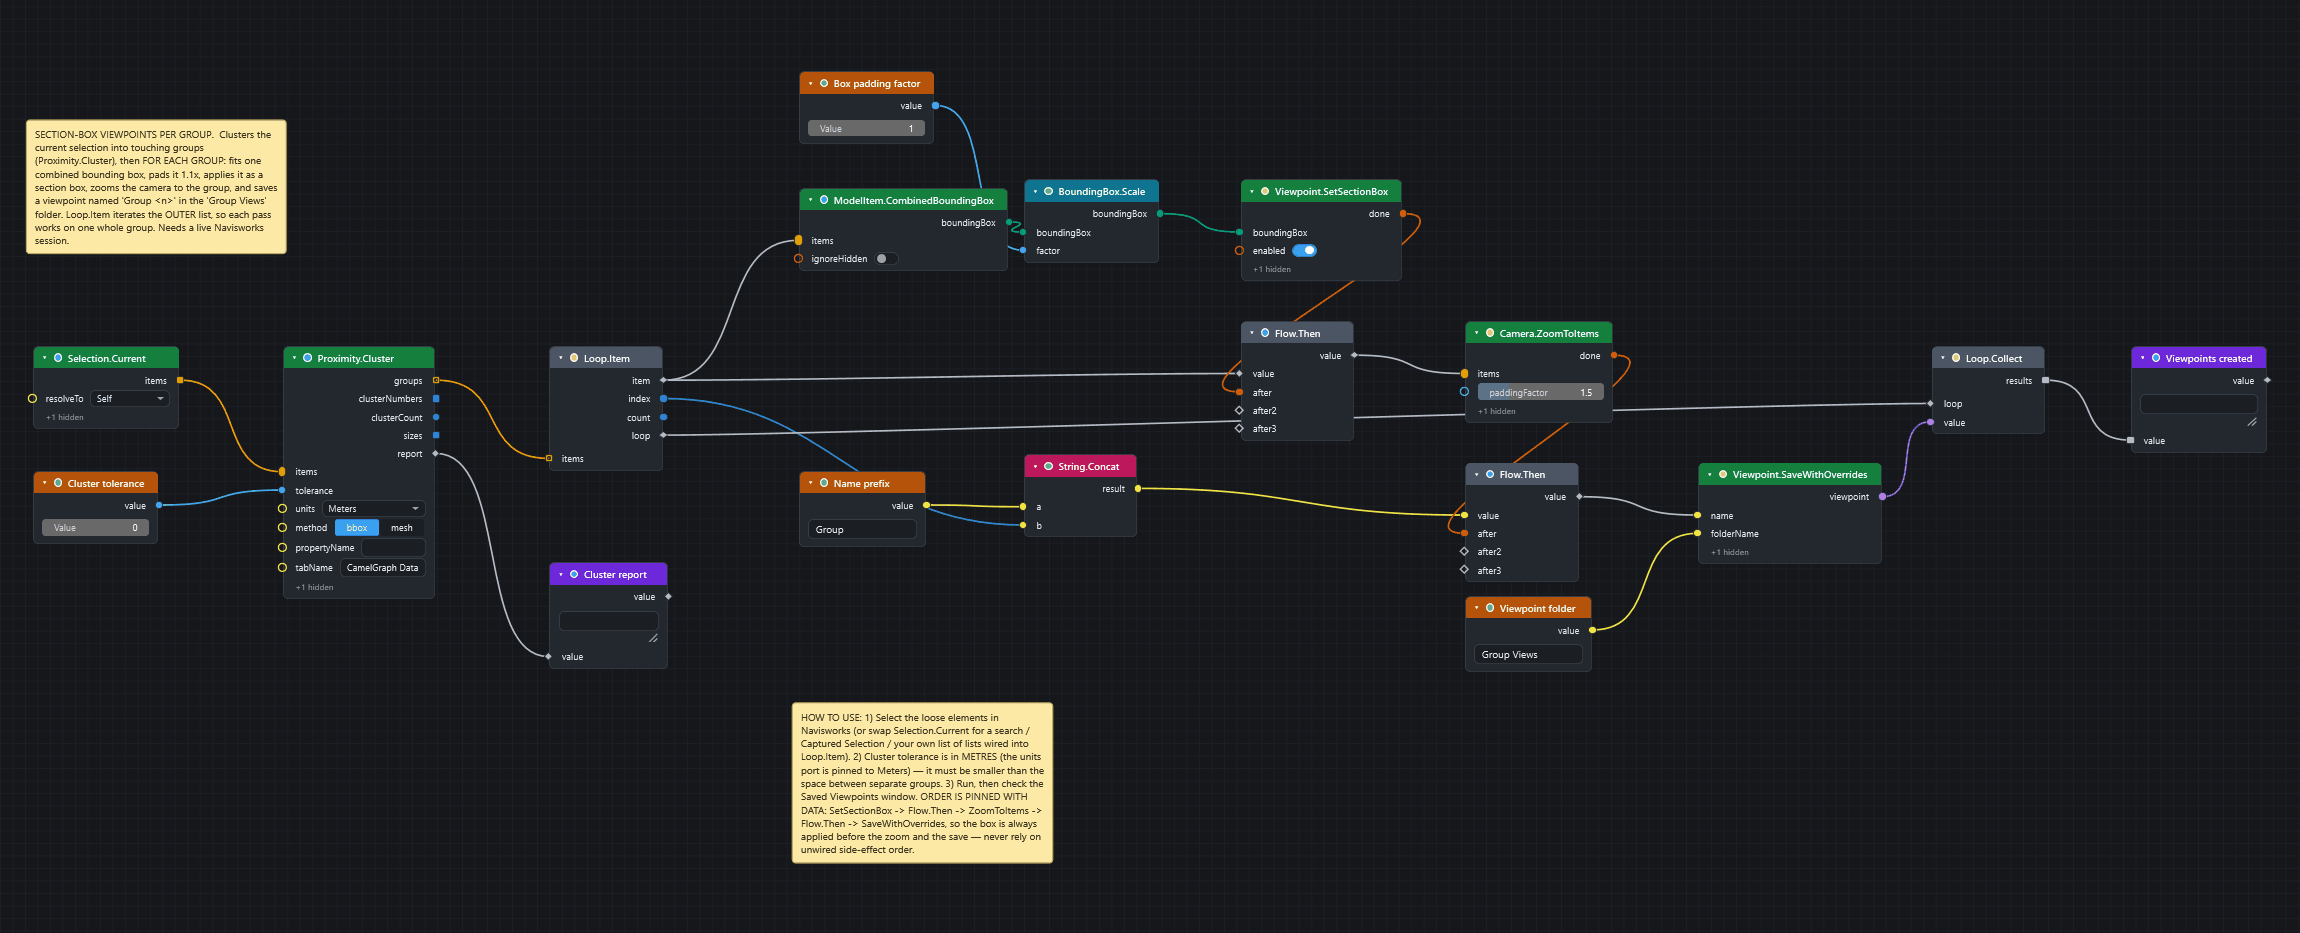
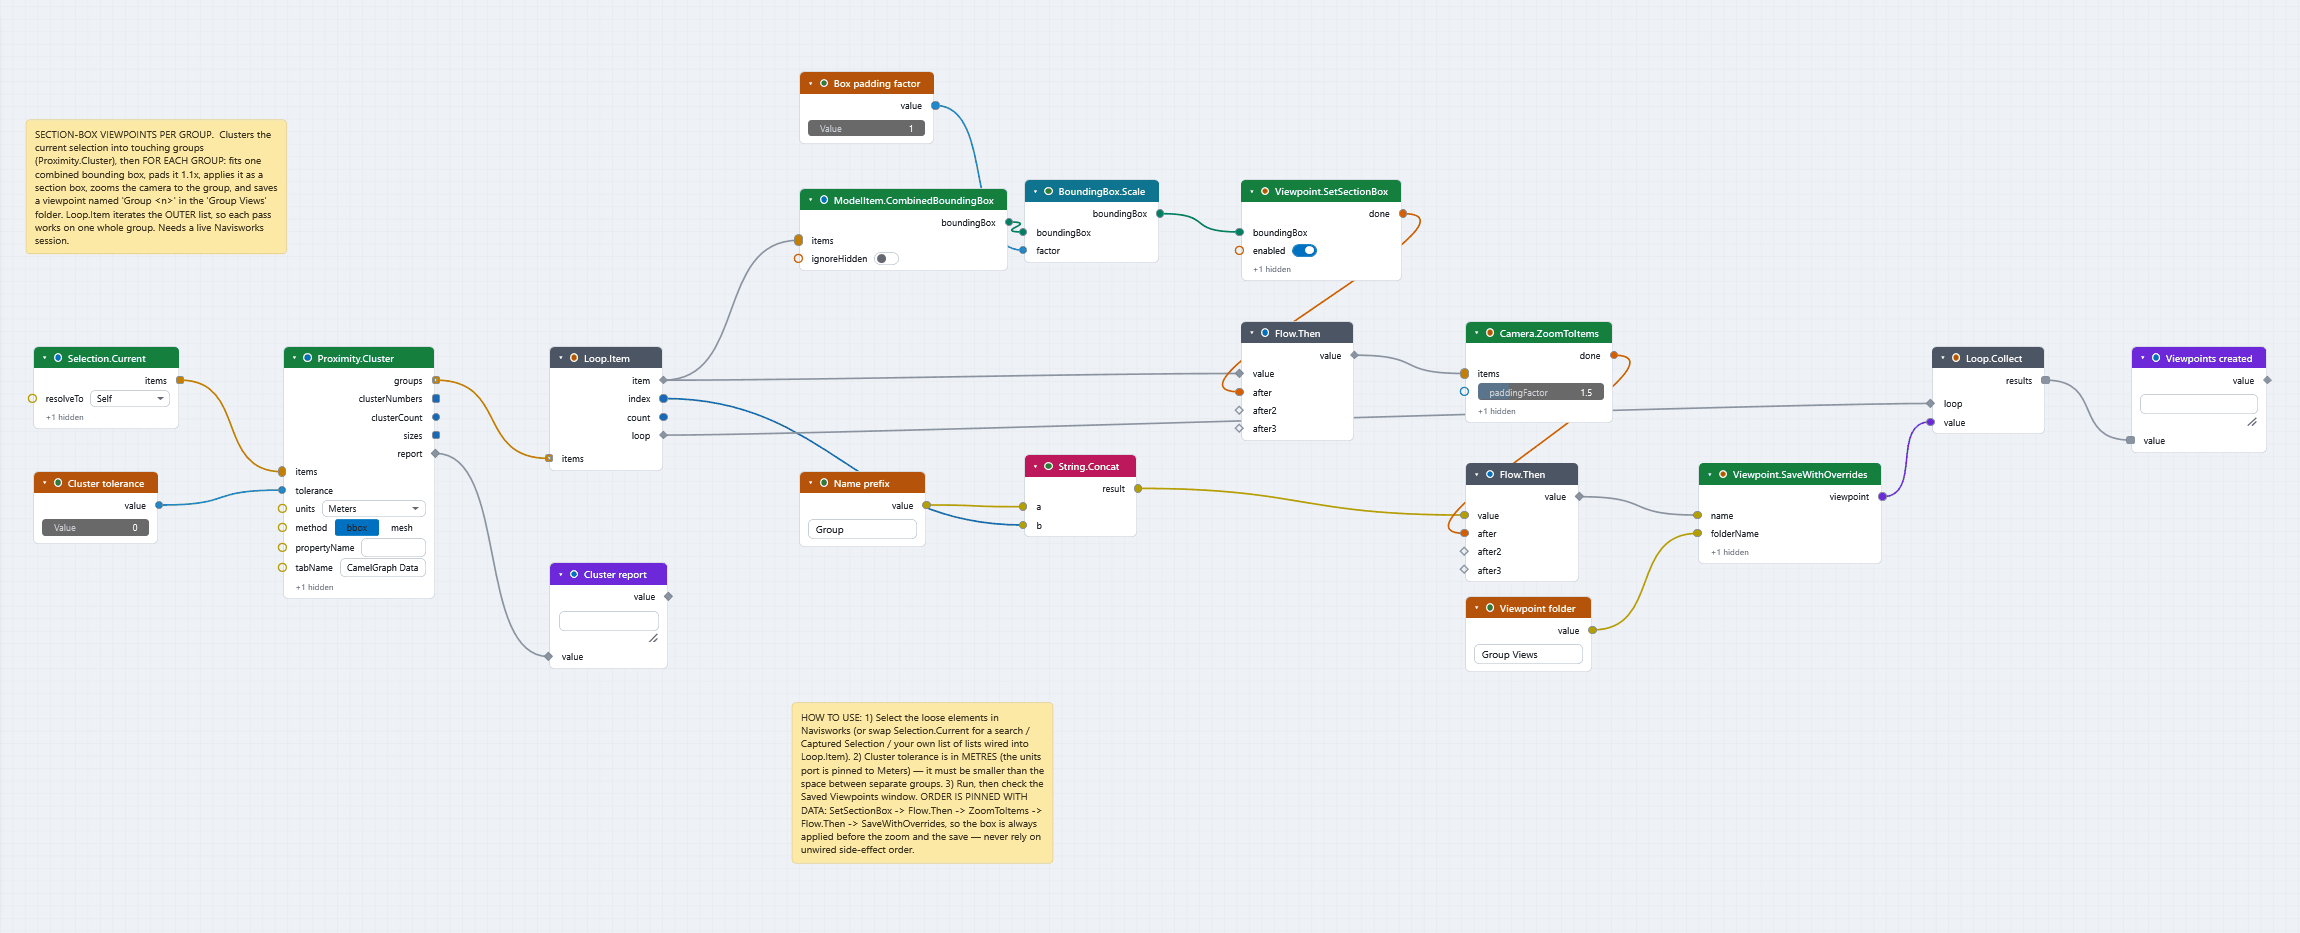
Save one viewpoint for every item builds the loop step by step.
Safety analysis
| Sample | What it does |
|---|---|
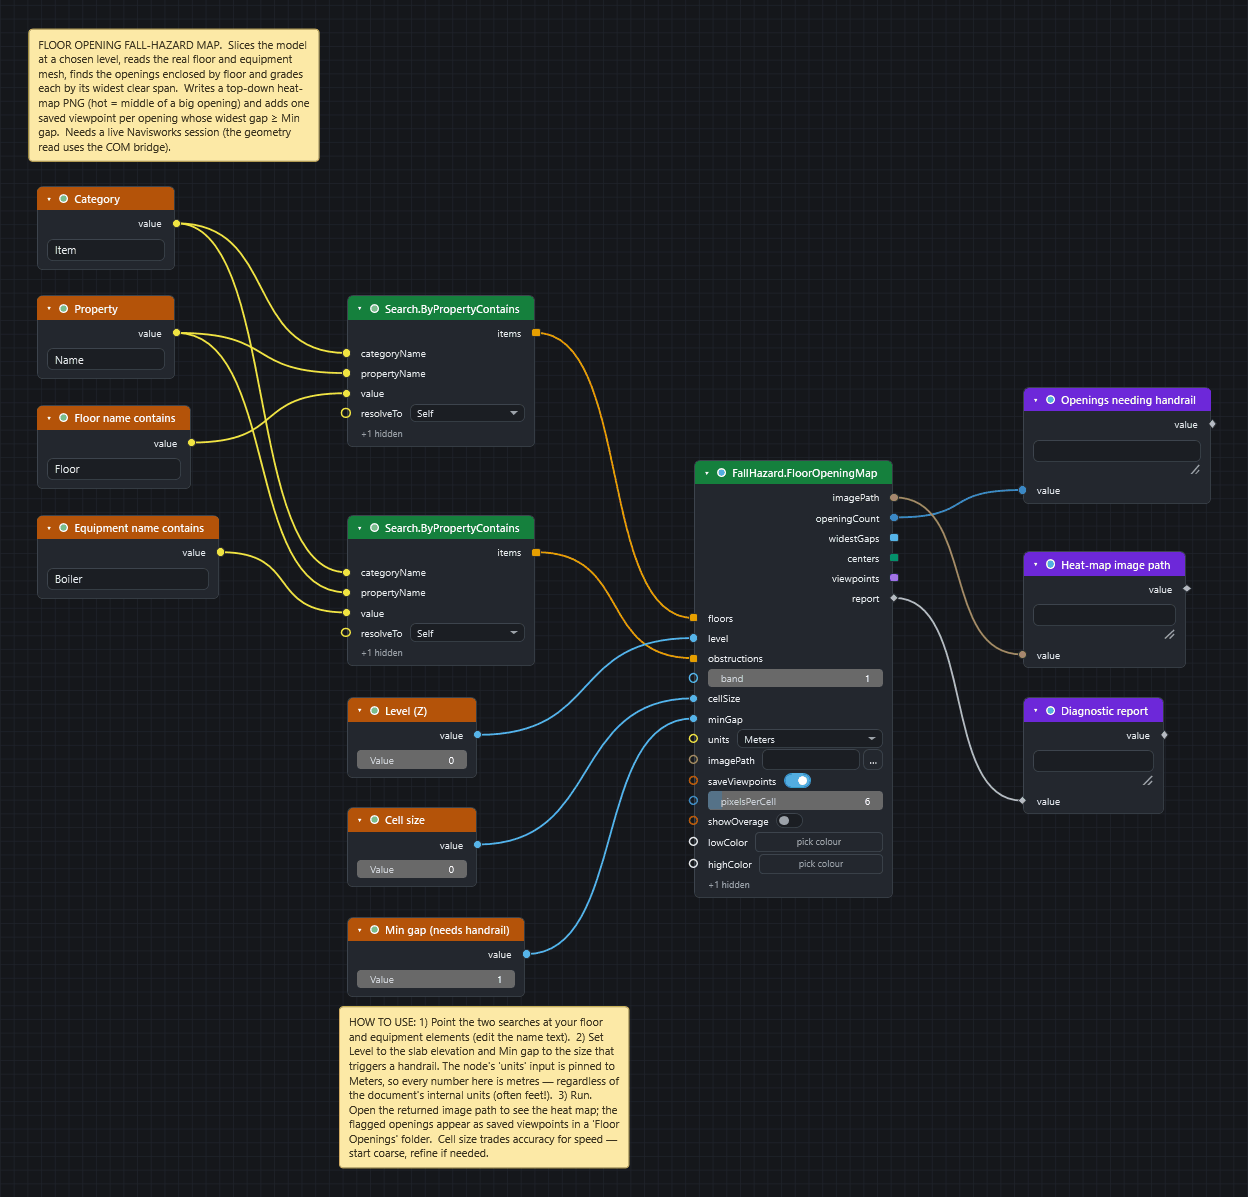
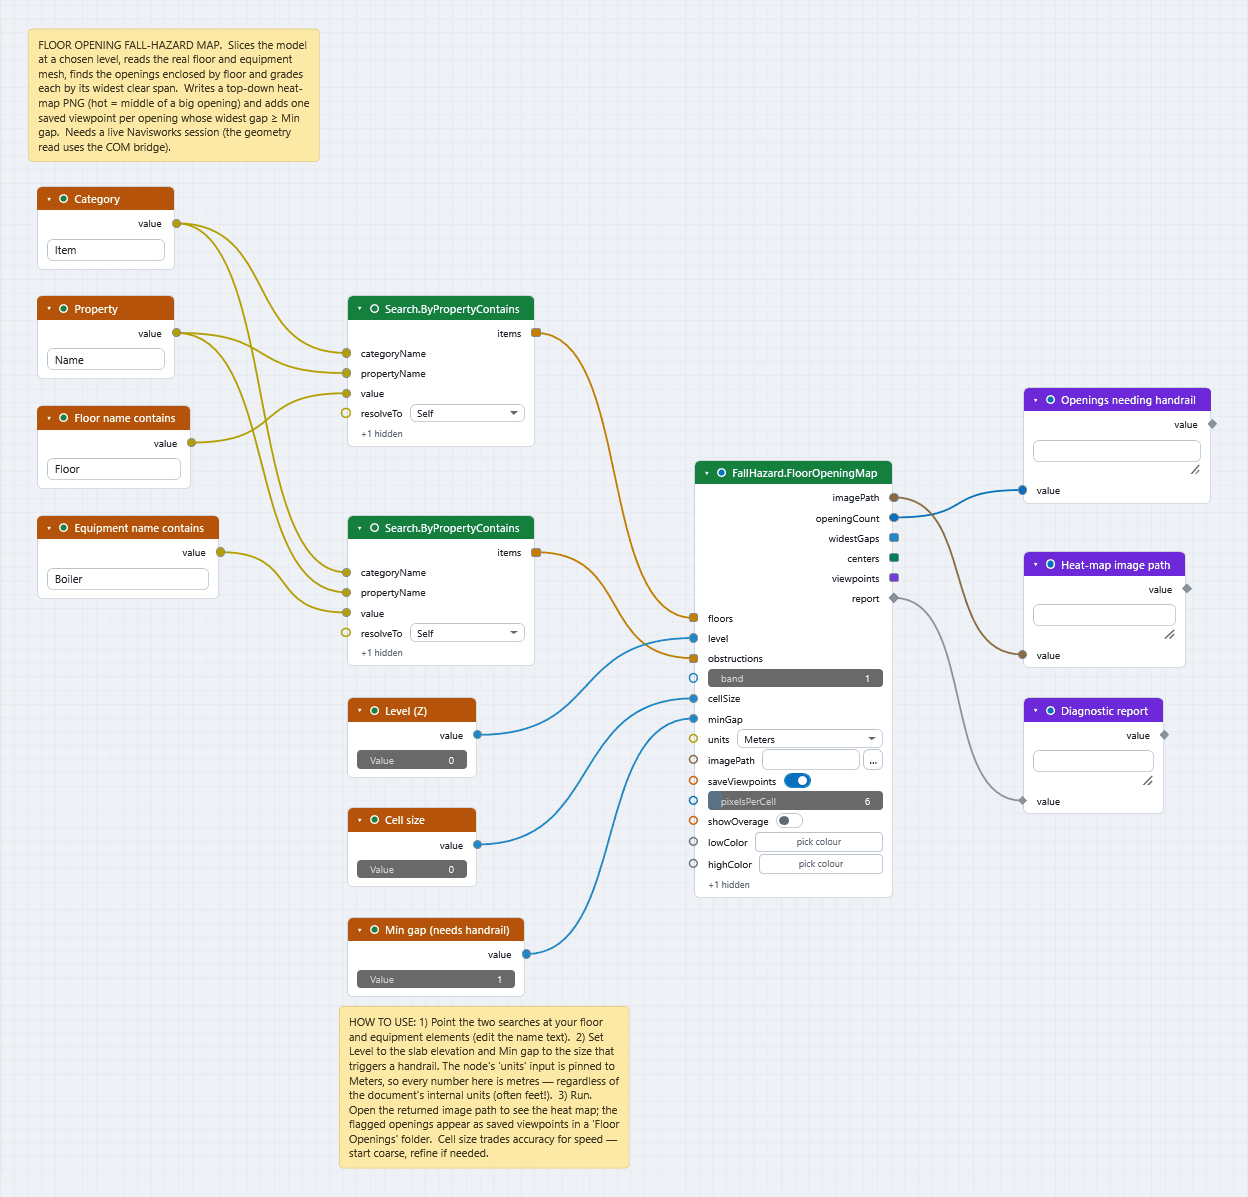
| Floor Opening Fall-Hazard Map | FallHazard.FloorOpeningMap slices the model at a level, reads the real floor and equipment mesh, finds the openings fully enclosed by floor and grades each by how far its centre is from the nearest edge. It writes a top-down heat-map PNG and saves one viewpoint per opening whose widest gap is at least your threshold. Needs a live Navisworks session; Cell size trades accuracy for speed. |
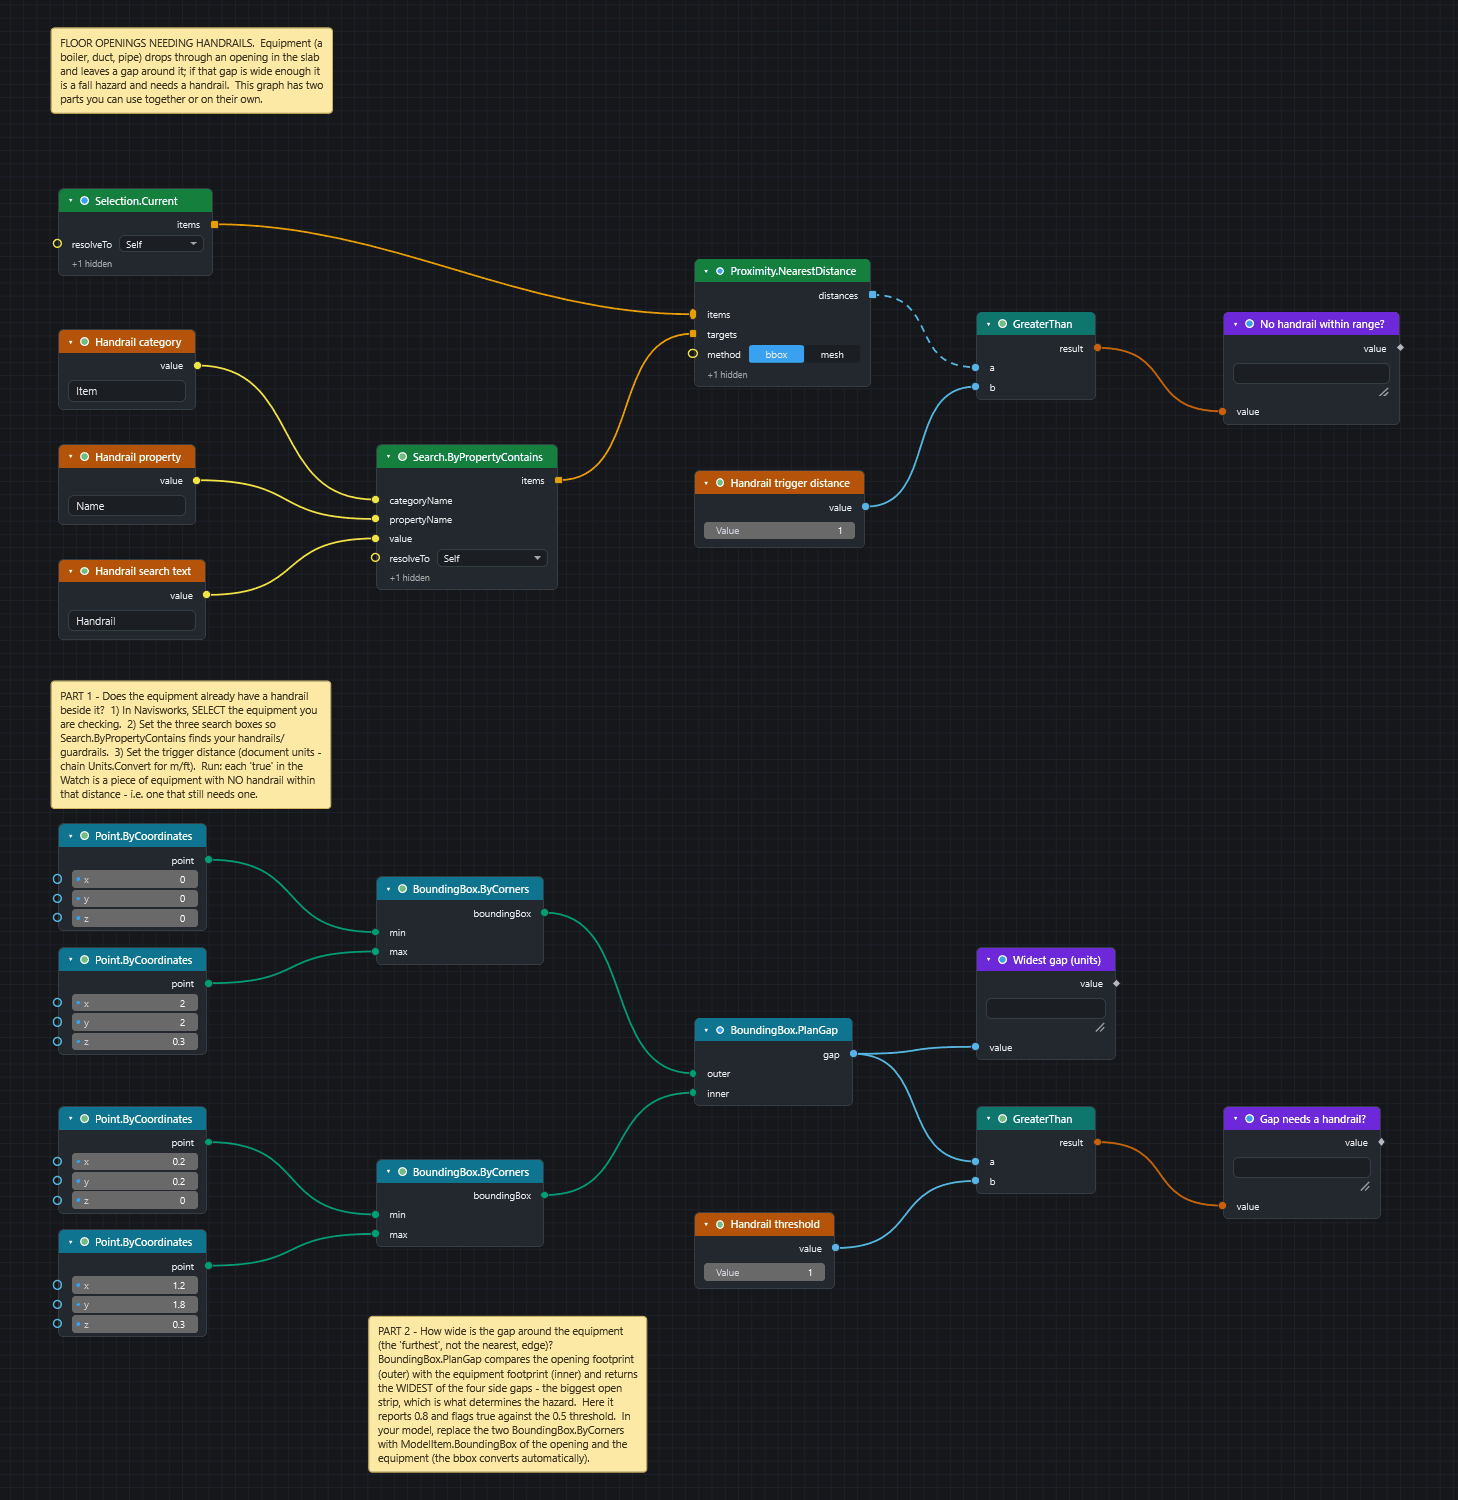
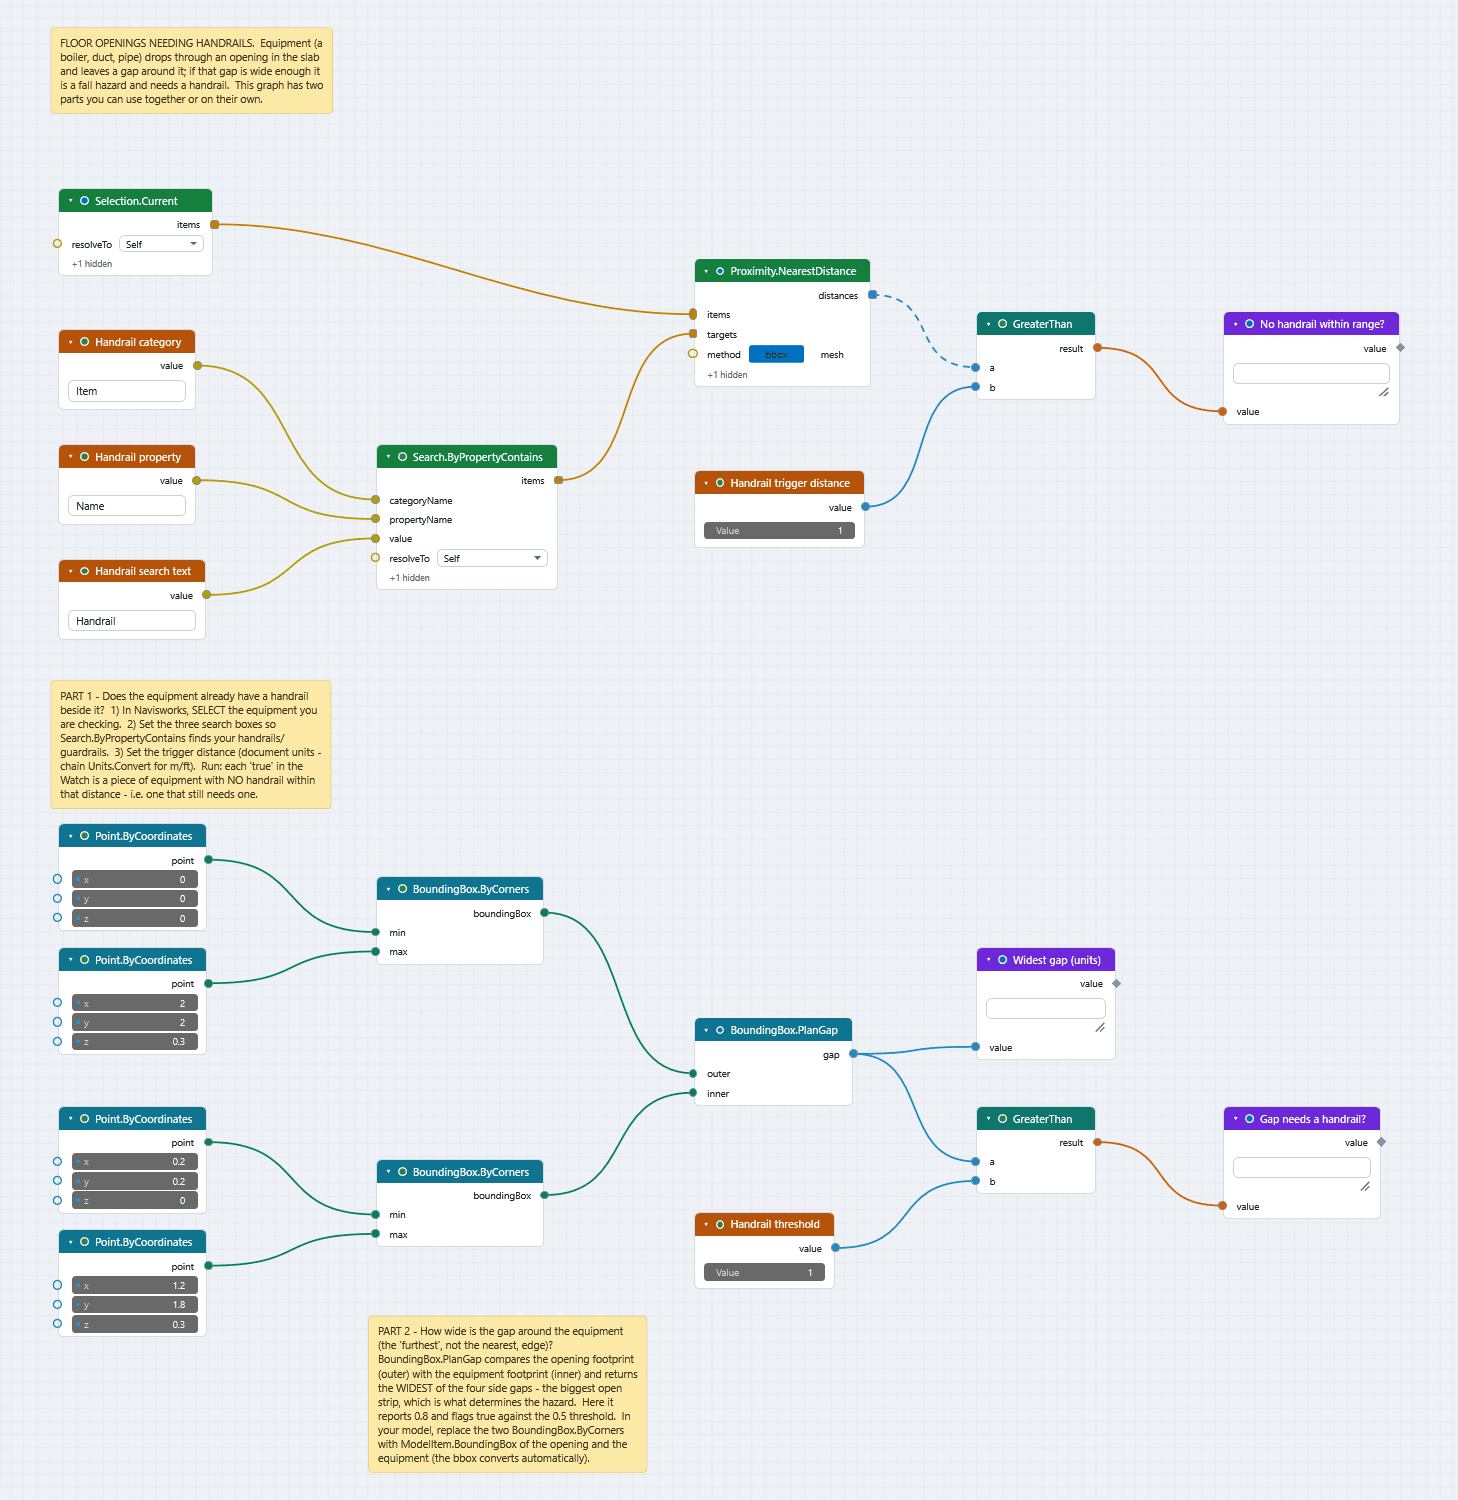
| Floor Openings Needing Handrails | Part 1 measures each item of the selection to its nearest handrail with Proximity.NearestDistance and flags the ones with none close by. Part 2 uses BoundingBox.PlanGap to find the widest gap between an opening and the equipment through it. Part 2 is self-contained and reports 0.8. |
For developers (not installed)
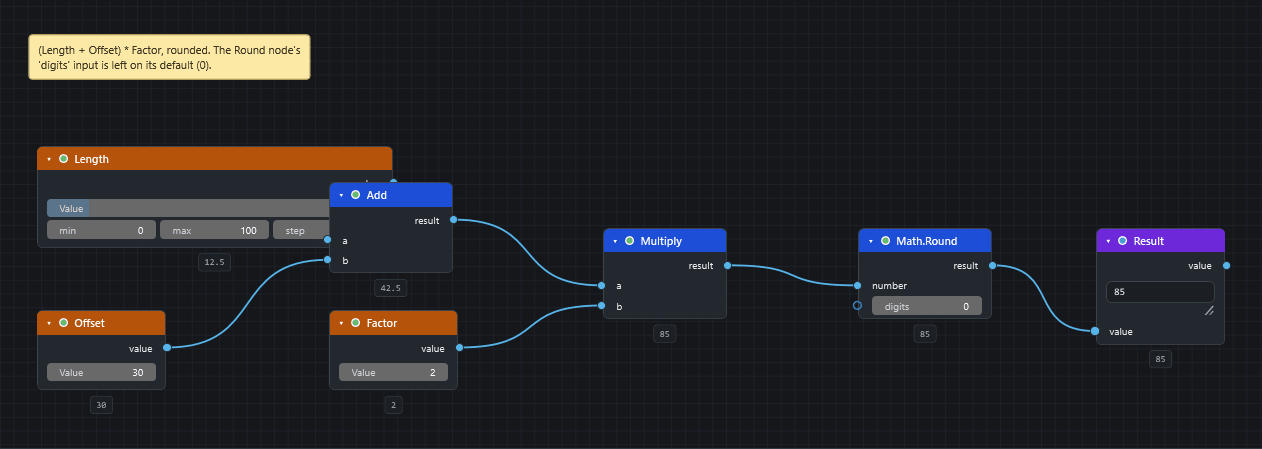
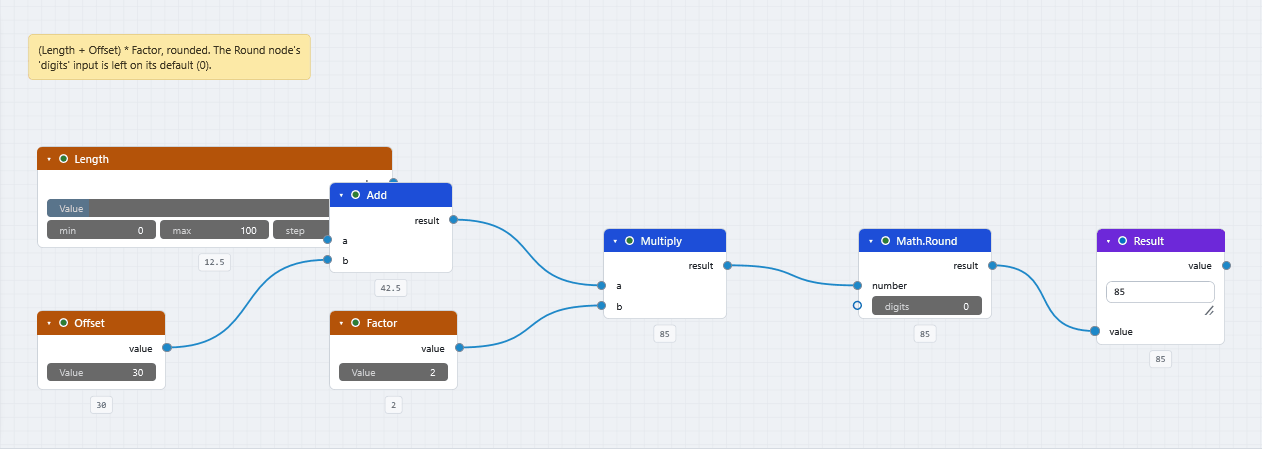
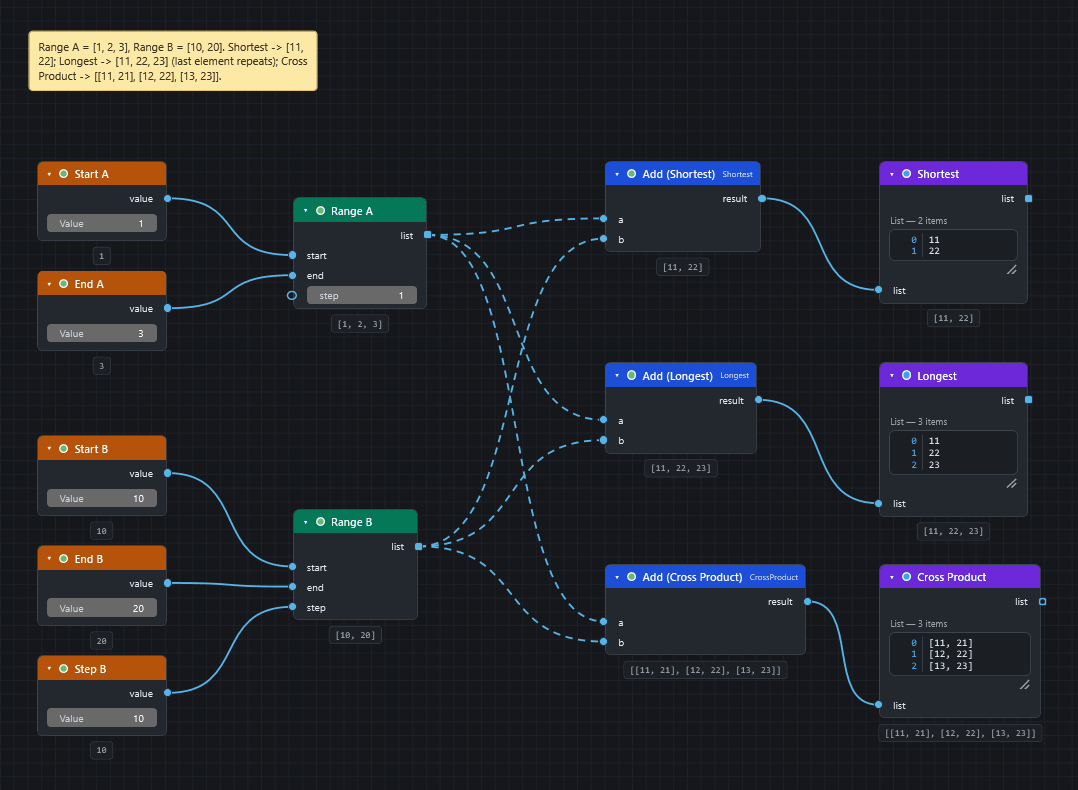
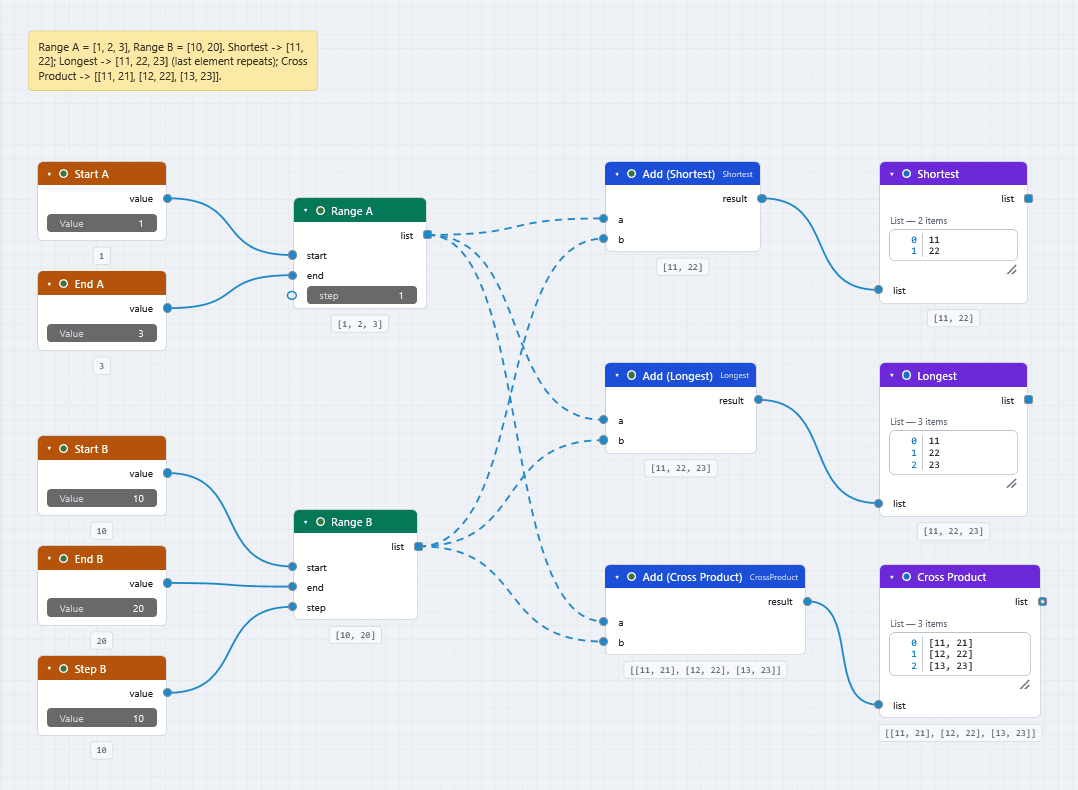
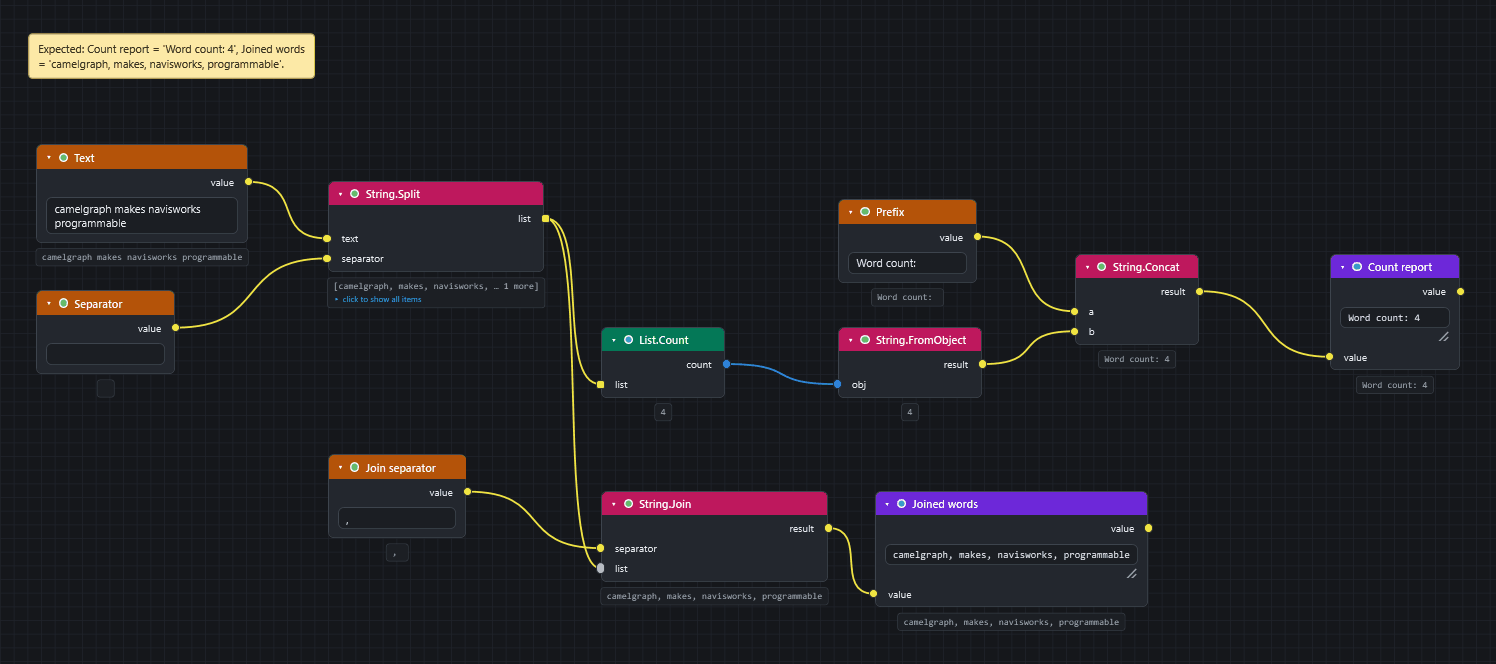
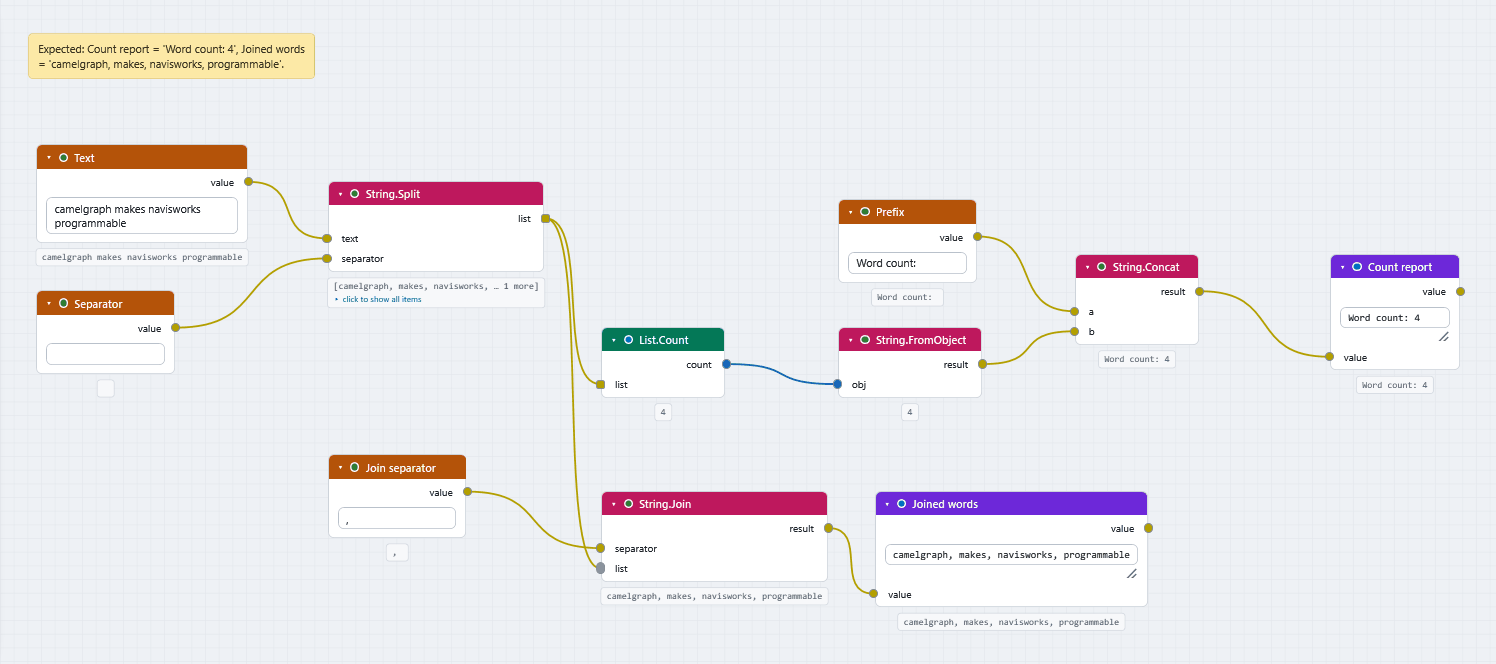
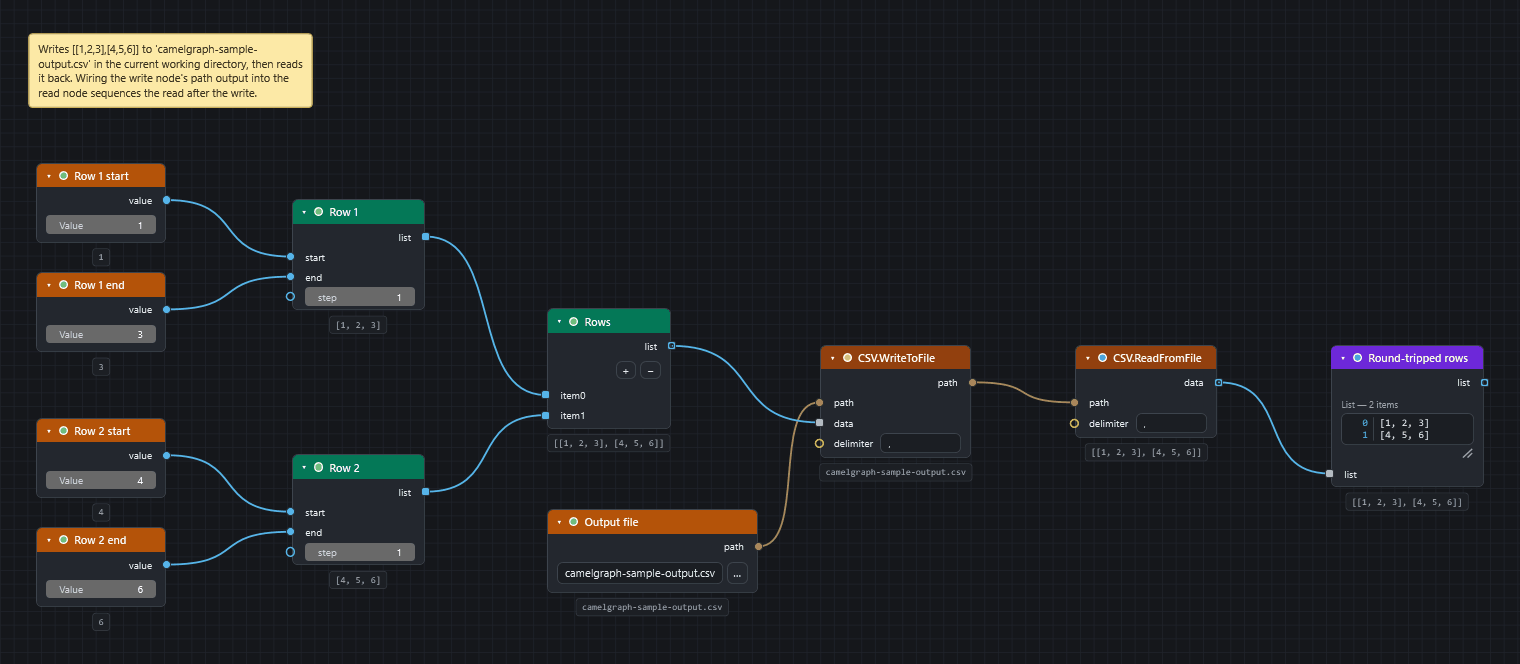
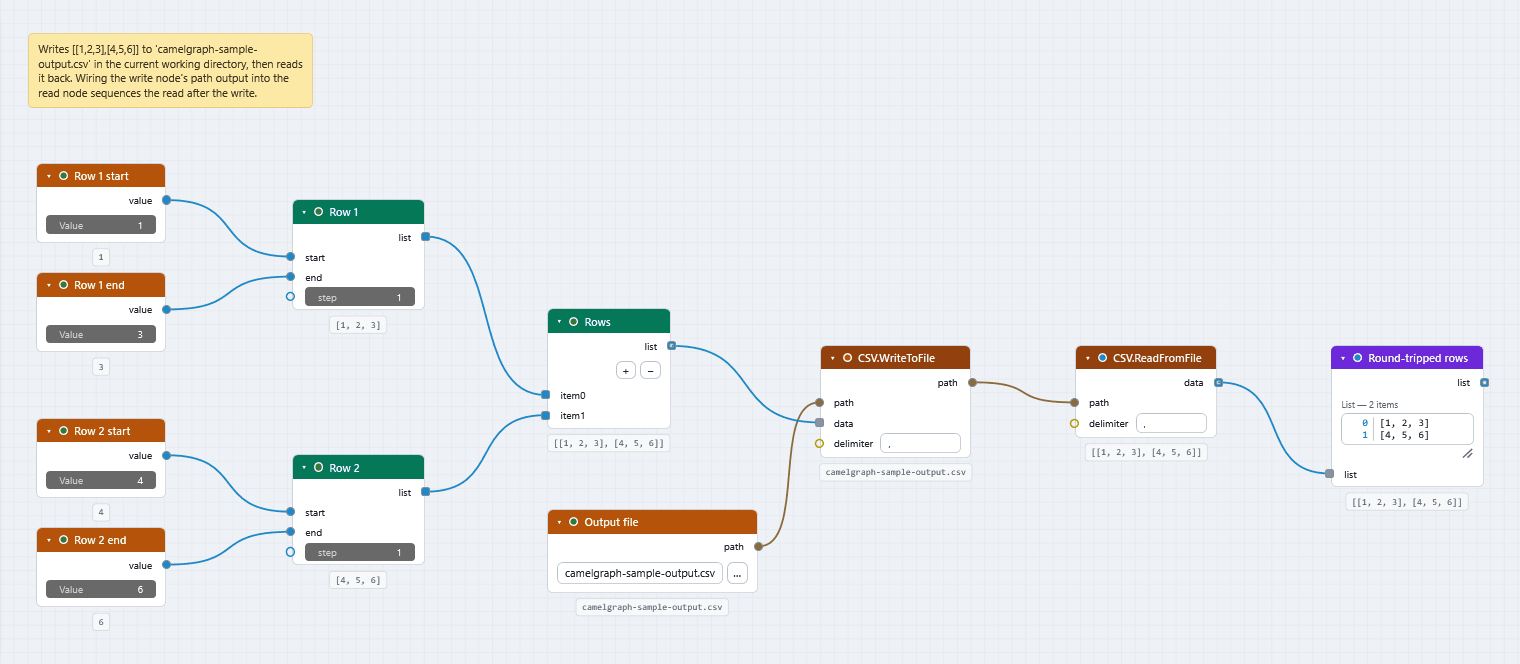
Four small graphs in the repository's samples folder exercise the engine without Navisworks and run on the command line: hello-math (result 85), list-lacing (the three lacing modes side by side), string-report (Word count: 4) and csv-roundtrip (writes and reads a CSV file). The last one writes a CSV file next to itself (see Troubleshooting). The four are developer test fixtures and are not part of the installer.
Use a sample as a starting point
- Save it under a new name first (File ▸ Save As…, Ctrl+Shift+S) so the original stays as it was.
- Change the typed inputs: the notes on the canvas say which ones are meant to be edited.
- Replace a search or a property name with your own, and press Run.
- Find where the sample's nodes live in the library: right-click a node and choose Find in Library.
Not sure where to begin?
Start with Getting Started - Math and Watch. It needs no model, and its Watch nodes should show 32 and Area = 32.
Next steps
- The How-to guides rebuild several of these samples step by step, with graphs to download.
- Recipes lists node chains by role.
- IFC, BCF, Excel and CSV explains the file formats the samples read and write.