Take quantities out to Excel
Goal: count items and total a quantity for each category, and save the result as an .xlsx file.
Before you start
- Open a model in Navisworks and the CamelGraph editor.
- Know the tab and property to read, for example Element ▸ Category and Element ▸ Volume in a Revit-sourced model (find the names). Use the names your model shows.
- Excel does not have to be installed. CamelGraph writes
.xlsxitself.
Steps
- Add a
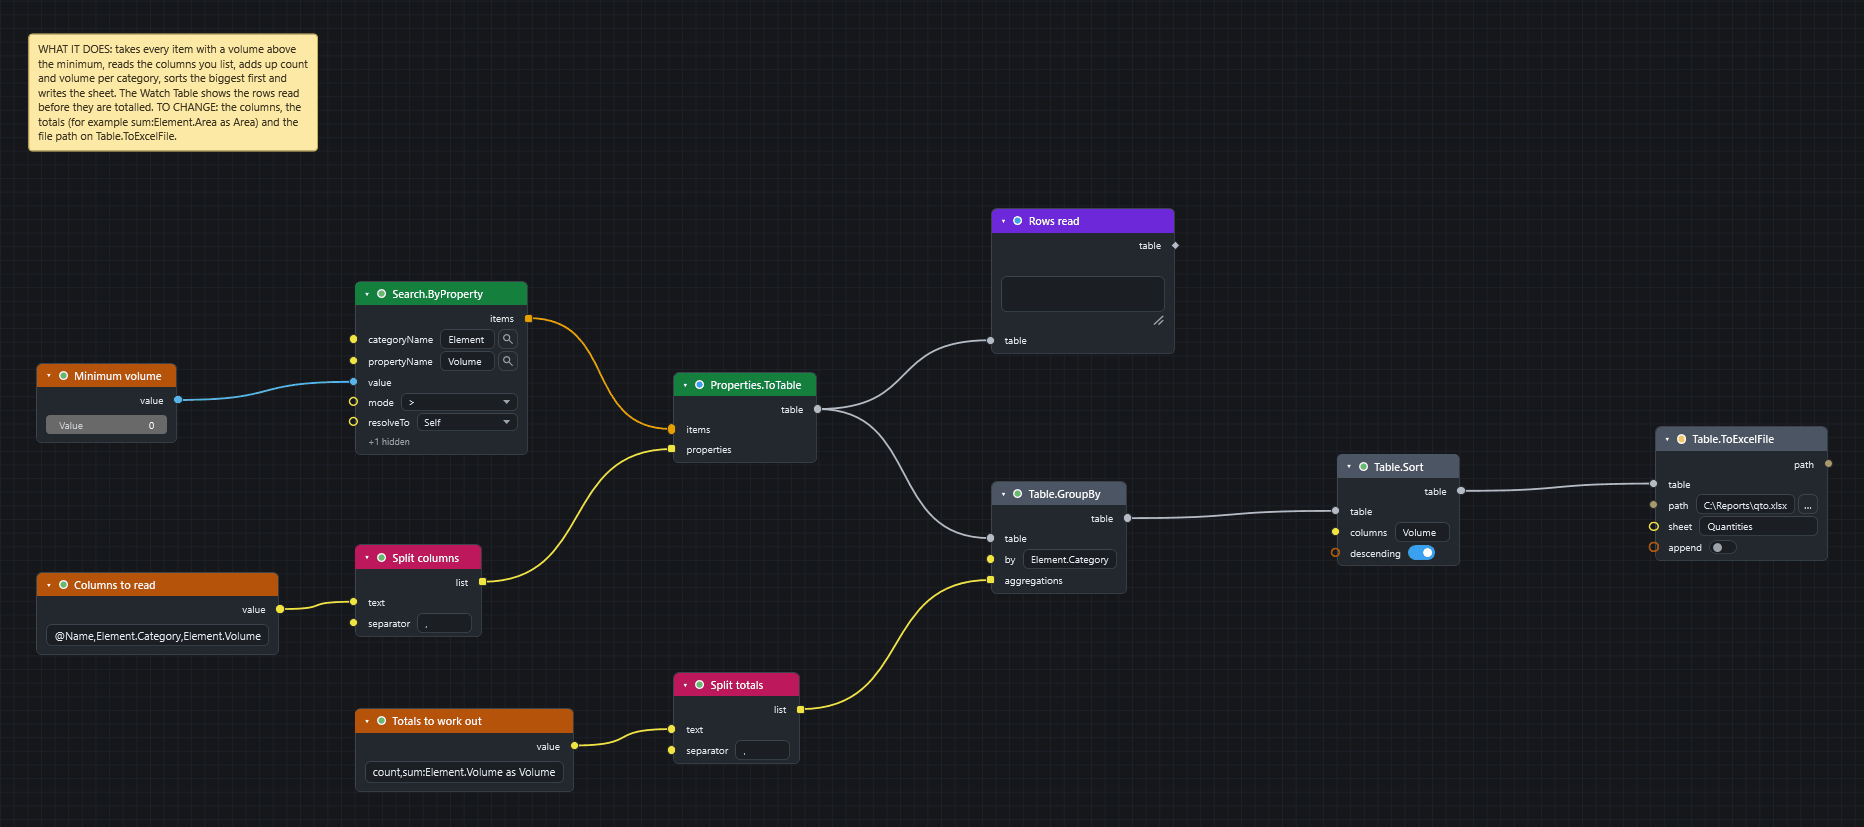
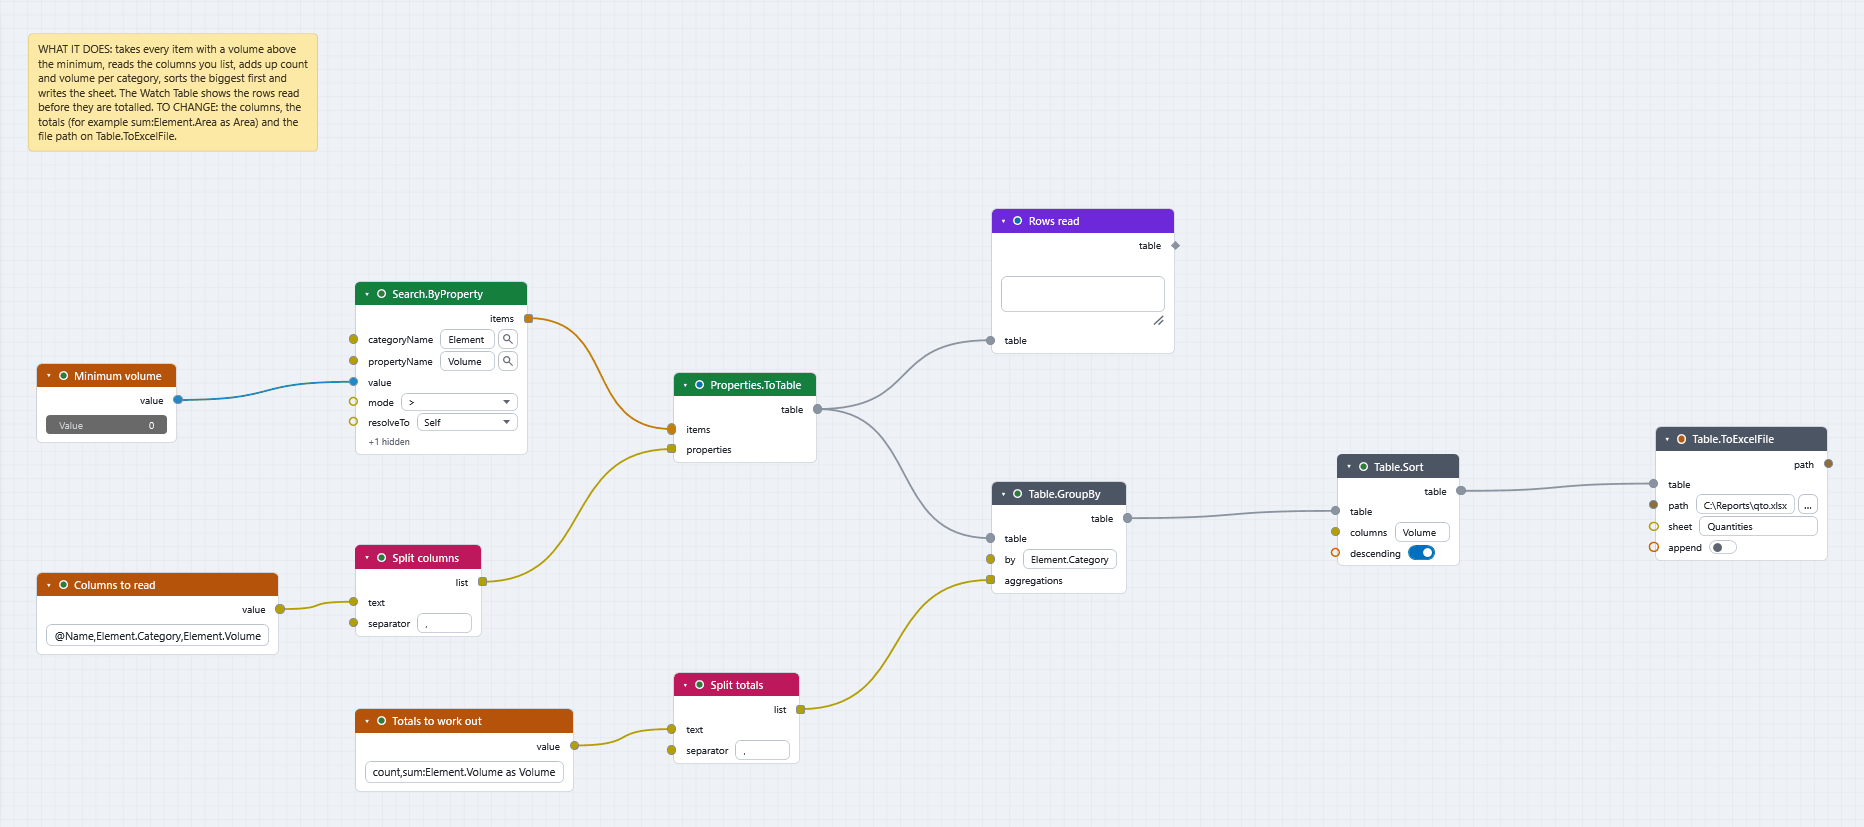
Numbernode (Input). Double-click its title and rename itMinimum volume. Leave the value at0. - Add
Search.ByProperty(Navisworks ▸ Search). TypeElementintocategoryName,VolumeintopropertyNameand choose>in themodedrop-down. Wire theNumberintovalue. It finds every item whose volume is above the minimum. - Add
Properties.ToTable(Navisworks ▸ Properties). Wireitemsfrom the search into itsitems. - Its
propertiesinput is a list of column names and has no box. Add aStringnode (Input), rename itColumns to readand type@Name,Element.Category,Element.Volume. Add aString.Split(String) with the separator,, wire theStringinto itstextand itslistintoproperties.@Nameis the item name; the others areCategory.Property. - Add a
Watch Table(Display), rename itRows read, and wire thetableoutput into it. Press F5 and check the rows. An empty cell means the item does not carry that property. - Add
Table.GroupBy(Table). Wire the table intotableand typeElement.Categoryintoby. - The
aggregationsinput has no box either. Add a secondString, rename itTotals to work outand typecount,sum:Element.Volume as Volume. Add a secondString.Splitwith the separator,and wire itslistintoaggregations. The result has one row for each category with the columnsElement.Category,countandVolume. - Add
Table.Sort(Table). Wire the table in, typeVolumeintocolumnsand tickdescending. The largest total comes first. - Add
Table.ToExcelFile(Table). Wire the sorted table in. Type a full path intopath, for exampleC:\Reports\qto.xlsx, andQuantitiesintosheet. - Press F5.
What you get
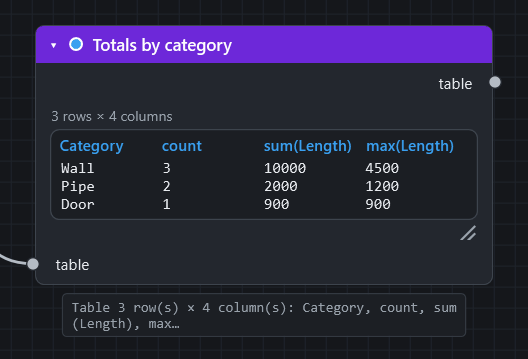
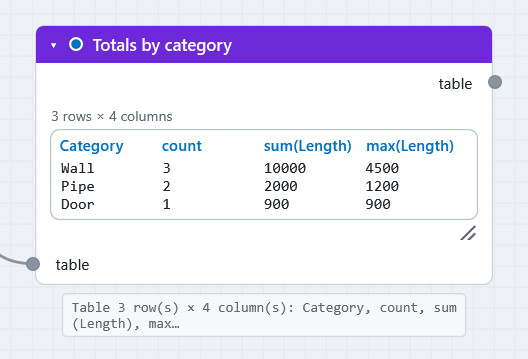
A workbook with one worksheet named Quantities. The first row holds the column names and each row below it is one category.
Where the workbook goes
A relative path such as Quantities.xlsx goes next to the graph file (or into Documents\CamelGraph if the graph has not been saved). A full path always works. Quotes that Explorer's Copy as path adds around a pasted path are removed.
Other aggregations
Table.GroupBy also works out average, min, max, median, first, last, list and distinct. Add as Name to name a result, as step 7 does.
If it does not work
- The file node fails: see A file node fails with "access denied".
- The table is empty: the search found nothing. See A search returns nothing.
- A node is red: see Read errors and warnings.
Next
- The sample QTO Rollup by Category does the grouping with one node,
Takeoff.SumPropertyByGroup(Sample scripts). - IFC, BCF, Excel and CSV lists the Excel and table nodes.
- Check how complete your data is.